by K. Richard, Apr 25, 2022 in NoTricksZone
A new study published in Geophysical Research Lettershighlights the abysmal model performance manifested in the latest Intergovernmental Panel on Climate Change report (AR6). The 38 CMIP6 general circulation models (GCMs) fail to adequately simulate even the most recent (1980-2021) warming patterns over 60 to 81% of the Earth’s surface.
Dr. Scafetta places particular emphasis on the poor performance of the highly uncertain estimates (somewhere between 1.83 and 5.67°C) of equilibrium climate sensitivity (ECS) and their data-model agreement relative to 1980-2021 global warming patterns.
The worst-performing ECS estimates are the ones projecting 3-4.5°C and 4.5-6°C warming in response to doubled CO2 concentrations (to 560 ppm) plus feedbacks, as the 1980-2021 temperature trends are nowhere close to aligning with these trajectories.
Instead, the projected global warming by 2050 (~2°C relative to 1750) associated with the lowest ECS estimates and implied by the warming observed over the last 40+ years is characterized as “unalarming” even with the most extreme greenhouse gas emissions (no mitigation efforts undertaken) growth rate.
In addition to the conclusion that “no model group succeeds reproducing observed surface warming patterns,” poor modeling of heat transfer physics, ocean and atmospheric circulation patterns, polar sea ice processes…is also evident in the latest IPCC report.
“Accurately reproducing regional temperature differences over the past 40+ years is beyond the capability of climate model simulations, and even fails for major ocean basins and continents.”
The fundamental modeling failures in simulating responses to sharply rising greenhouse gas emissions over the last 40+ years “calls into question model-based attribution of climate responses to anthropogenic forcing.”
…
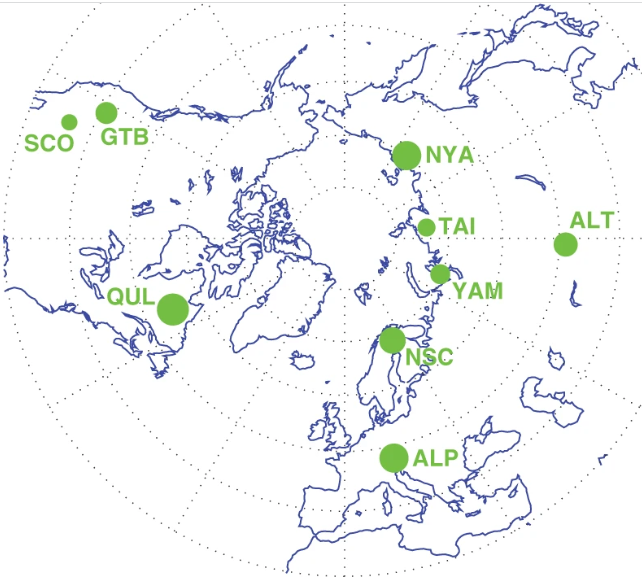 Cropped from Figure 1,