Archives de catégorie : climate-debate

Manufacturing consensus: the early history of the IPCC

by J. Curry, January 3, 2018 in ClimateEtc.


Short summary: scientists sought political relevance and allowed policy makers to put a big thumb on the scale of the scientific assessment of the attribution of climate change.

Bernie Lewin has written an important new book:

SEARCHING FOR THE CATASTROPHE SIGNAL:The Origins of The Intergovernmental Panel on Climate Change

The importance of this book is reflected in its acknowledgements, in context of assistance and contributions from early leaders and participants in the IPCC:

This book would not have been possible without the documents obtained via Mike MacCracken and John Zillman. Their abiding interest in a true and accurate presentation of the facts prevented my research from being led astray. Many of those who participated in the events here described gave generously of their time in responding to my enquiries, they include Ben Santer, Tim Barnett, Tom Wigley, John Houghton, Fred Singer, John Mitchell, Pat Michaels . . . and many more.

You may recall a previous Climate Etc. post Consensus by Exhaustion, on Lewin’s 5 part series on Madrid 1995: The last day of climate science.

Read the whole book, it is well worth reading.  The focus of my summary of the book is on Chapters 8-16 in context of the theme of ‘detection and attribution’, ‘policy cart in front of the scientific horse’ and ‘manufacturing consensus’. Annotated excerpts from the book are provided below.

Cold Air Rises – How Wrong Are Our Global Climate Models?

by University of California Davis,  May 6, 2020 in WUWT


The lightness of water vapor buffers climate warming in the tropics.

Conventional knowledge has it that warm air rises while cold air sinks. But a study from the University of California, Davis, found that in the tropical atmosphere, cold air rises due to an overlooked effect — the lightness of water vapor. This effect helps to stabilize tropical climates and buffer some of the impacts of a warming climate.

The study, published today (May 6, 2020) in the journal Science Advances, is among the first to show the profound implications water vapor buoyancy has on Earth’s climate and energy balance.


Abstract

Moist air is lighter than dry air at the same temperature, pressure, and volume because the molecular weight of water is less than that of dry air. We call this the vapor buoyancy effect. Although this effect is well documented, its impact on Earth’s climate has been overlooked. Here, we show that the lightness of water vapor helps to stabilize tropical climate by increasing the outgoing longwave radiation (OLR). In the tropical atmosphere, buoyancy is horizontally uniform. Then, the vapor buoyancy in the moist regions must be balanced by warmer temperatures in the dry regions of the tropical atmosphere. These higher temperatures increase tropical OLR. This radiative effect increases with warming, leading to a negative climate feedback. At a near present-day surface temperature, vapor buoyancy is responsible for a radiative effect of 1 W/m2 and a negative climate feedback of about 0.15 W/m2 per kelvin.

Influence of landscape structure on local and regional climate

by RA. Pielke and R. Avissar, 1990 in LandscapeEcology


Abstract

This paper discusses the physical linkage between the surface and the atmosphere, and demonstrates how even slight changes in surface conditions can have a pronounced effect on weather and climate. Observational and modeling evidence are presented to demonstrate the influence of landscape type on the overlying atmospheric conditions. The albedo, and the fractional partitioning of atmospheric turbulent heat flux into sensible and latent fluxes is shown to be particularly important in directly affecting local and regional weather and climate. It is concluded that adequate assessment of global climate and climate change cannot be achieved unless mesoscale landscape characteristics and their changes over time can be accurately determined.

Michael Moore Ditches Green Movement For Climate Commies

by C. Toto, May 8, 2020 in ClimateChangeDispatch


Michael Moore has had enough of the modern green movement.

The Oscar-winning director made it official late last month by unleashing his new project, for free, on YouTube.

“The Planet of the Humans,” which Moore executive produced and shared via his Rumble Media platform, excoriates some of the green movement’s sacred cows:

  • Wind Energy
  • Solar Power
  • Electric Cars
  • Al Gore

The documentary shreds all of the above, albeit from a decidedly progressive perspective. Solar and wind, no matter how well-intentioned those who support them, can’t power the planet. Electric cars require fossil fuels, a non-starter for saving the world.

 …
SEE THE VIDEO HERE (in text)

Claim: Antarctic Sea Ice Growth Caused by Meltwater

by Eric Worrall, May 7, 2020 in WUWT


According to climate scientists, less dense meltwater on the surface of the Antarctic ocean reduced convection between the surface and ocean depths, leaving heat trapped in the depths.

A

Don’t you love climate science? When sea ice accumulates, scientists adjust the models until they get the right result. When the sea ice melts, well that is what you would expect from global warming.

NOAA Satellite records second largest 2-month temperature drop in history

by Anthony Watts, May 1, 2020 in WUWT


UPDATE: Changed emphasis from Northern Hemisphere extratropics to entire Northern Hemisphere (h/t John Christy)

In April, 2020, the Northern Hemisphere experienced its 2nd largest 2-month drop in temperature in the 497-month satellite record.

The Version 6.0 global average lower tropospheric temperature (LT) anomaly for April, 2020 was +0.38 deg. C, down from the March, 2020 value of +0.48 deg. C.

The Northern Hemisphere temperature anomaly fell from +0.96 deg. C to 0.43 deg. C from February to April, a 0.53 deg. C drop which is the 2nd largest 2-month drop in the 497-month satellite record. The largest 2-month drop was -0.69 deg. C from December 1987 to February 1988.

The linear warming trend since January, 1979 has now increased to +0.14 C/decade (but remains statistically unchanged at +0.12 C/decade over the global-averaged oceans, and +0.18 C/decade over global-averaged land).

Global Mean Temperature Flattens the Past

by Andy May, May3, 2020 in WUWT


Introduction

There have been recent discussions about ‘flattening the curve’ and some curves are easier to flatten than others. The Pages 2K Consortium calculates global mean temperature in a manner that flattens the long-term trend and makes present day temperatures appear warmer relative to past temperatures. Across the globe, temperature reconstructions show cooling millennial temperature trends with one exception, the Pages 2K global mean.

Millennial Temperature Trends Show Global Cooling

Global mean surface temperature anomalies were recently calculated by the Pages 2K Consortium led by Nuekom, 2019. Their statistical means are a conglomeration of seven different averaging methods for 7000 proxy records over the past 2000 years. The median across all global mean methods is plotted as a dashed line in Figure 1 and compared to Pages 2K’s published regional reconstructions. All means demonstrate similar trends as the median and will be simply be referred to as the global mean(s).

Regional temperature reconstructions are chosen that utilize similar proxy datasets used in the global mean calculation. The Arctic reconstruction by McKay incorporates a balance of proxy records consisting of ice cores, tree rings, lake and marine sediments north of 60 deg N. The Northern Hemisphere (NH) European reconstruction by Luterbacher is tree ring proxy based. And Stenni’s Antarctic reconstruction uses predominantly ice core isotopes.

The Pages 2K global mean appears to be reasonable compared to regional reconstructions from Present through the Little Ice Age (LIA) until about 1250 AD. Although it is difficult to see how the mean compares to regional reconstructions during the Present when using a 1961-1990 baseline as all reconstructions converge creating the “hockey stick” effect. Pre-1250 AD, the global mean appears to parallel NH Europe temperatures largely ignoring the Antarctic.


Figure 1: Top graph are surface temperature reconstructions with a 50-year loess filter plotted with Pages 2K global mean of the 7000-member ensemble across all methods. Bottom graph shows linear trends over the past 2000 years.

GLOBAL TEMPERATURES SUFFER SECOND LARGEST TWO MONTH DROP IN RECORDED HISTORY

by Cap Allon, May 6, 2020 in Electroverse


The Temperature of the Global Lower Atmosphere plunged 0.38C through March and April, halving its February above baseline high of 0.76C to 0.38C — the second-largest two-month drop in the UAH temperature dataset.

The largest two month drop remains the 0.69C observed back in 1987. And note how the global average temperature back in 1987 –before both the drop AND the inception of the global warming scare is EXACTLY the same as it is now:


A continuation of this sharp downward plunge (seen in March and April, 2020) is highly probable over the coming months (with the odd bump on the way), and we can now consider a reading below baseline by the end of the year “likely”.

For a more in-depth look at the data check out this video from the Oppenheimer Ranch Project:


Rural Northern US Stations Showed No Warming – Before NASA Rewrote The Data

by P. Gosselin, May 03, 2020 in NoTricksZone


The northern hemisphere surface temperature was expected to drop substantiallyaccording to NCEP, but this of course will not keep global warming alarmists from sounding the warming alarms.

But a look at the unadjusted data from some rural US stations tells us that there has been no warming.

Today we look at temperature data from NASA of some stations along the northern US with a Brightness Index (BI) of 0, meaning rural locations with no urban heat island effects. We want to see the trend over the past 100 or so years.

Plotted are the USHCN Version 4 versus Version 4 adjusted.

The first plots are the data from Lincoln, Nebraska going back to 1901:

Modest cooling changed to warming. Data: NASA

Note how a modest cooling trend was changed to a warming trend. Very ealy temperatures were cooled by 2°C!

Next we move to the Livingston, Montana station, where here as well a modest cooling trend was transformed into warming by massively adjusting past temperatures downward also by more than 2°C:

Study: CO2 Emissions From Dry Inland Waters Much Higher Than Thought

by Ufz, Mau 1, 2020 in ClimateChangeDispatch


Inland waters such as rivers, lakes, and reservoirs play an important role in the global carbon cycle.

Calculations that scale up the carbon dioxide emissions from land and water surface areas do not take account of inland waters that dry out intermittently.

This means that the actual emissions from inland waters have been significantly underestimated—as shown by the results of a recent international research project led by scientists at the Helmholtz Centre for Environmental Research (UFZ) in Magdeburg and the Catalan Institute for Water Research (ICRA).

The study was published in Nature Communications.


“The interaction of local conditions like temperature, moisture, and the organic matter content of the sediments is crucial, and it has a bigger influence than regional climate conditions,” Keller explains.

So what do the results of the study mean for the future assessment of carbon dioxide emissions from inland waters? “Our study shows that carbon dioxide emissions from inland waters have been significantly underestimated up until now,” says Koschorreck.

Chinese Scientists: It Was Warmer In China During Medieval Warm Period Than Today

by Hao et al. , January  2, 2020  in GWPF


For China as a whole, the longest warm period during the last 2000 years occurred in the 10th–13th centuries’

Abstract: The Medieval Climate Anomaly (MCA, AD950-1250) is the most recent warm period lasting for several hundred years and is regarded as a reference scenario when studying the impact of and adaptation to global and regional warming. In this study, we investigated the characteristics of temperature variations on decadal-centennial scales during the MCA for four regions (Northeast, Northwest, Central-east, and Tibetan Plateau) in China, based on high-resolution temperature reconstructions and related warm-cold records from historical documents. The ensemble empirical mode decomposition method is used to analyze the time series. The results showed that for China as a whole, the longest warm period during the last 2000 years occurred in the 10th–13th centuries, although there were multi-decadal cold intervals in the middle to late 12th century. However, in the beginning and ending decades, warm peaks and phases on the decadal scale of the MCA for different regions were not consistent with each other. On the inter-decadal scale, regional temperature variations were similar from 950 to 1130; moreover, their amplitudes became smaller, and the phases did not agree well from 1130 to 1250. On the multi-decadal to centennial scale, all four regions began to warm in the early 10th century and experienced two cold intervals during the MCA. However, the Northwest and Central-east China were in step with each other while the warm periods in the Northeast China and Tibetan Plateau ended about 40–50 years earlier. On the multi-centennial scale, the mean temperature difference between the MCA and Little Ice Age was significant in Northeast and Central-east China but not in the Northwest China and Tibetan Plateau. Compared to the mean temperature of the 20th century, a comparable warmth in the MCA was found in the Central-east China, but there was a little cooling in Northeast China; meanwhile, there were significantly lower temperatures in Northwest China and Tibetan Plateau.

L’Antarctique géologique (2/2)

by A. Préat, 1 mai 2020 in ScienceClimatEnergie


Cet article fait suite aux trois récents articles publiés par le Prof. Maurin sur SCE (1/3, 2/3,  3/3), et traite de l’évolution géologique de la plaque Antarctica.
Voir également L’Antarctique géologique (1/2).

3/ Situation récente à l’échelle géologique

3.1. Isolation de la plaque Antarctique

Nous arrivons ainsi à la situation actuelle avec l’Arctique et l’Antarctique, situation décrite dans les parties 1 à 3 des articles de M. Maurin (parties 1/3, 2/3 et 3/3). D’où proviennent les glaciations actuelles ? Pour les comprendre il faut remonter au début de l’ère cénozoïque en considérant l’Antarctique qui était en position polaire (Scotese, 2001).

La plaque antarctique, partie intégrante de l’ensemble des continents formant le Gondwana est entourée dès le Jurassique (Figs. 7 et 12, inL’Antarctique géologique 1/2) de rides médio-océaniques (excepté la péninsule antarctique qui provient d’une limite de plaque convergente active avec failles transformantes séparant la plaque Antarctique et la plaque Scotia). En conséquence, la plaque Antarctique est actuellement en expansion par rapport aux plaques adjacentes, et fut particulièrement stable et isolée par rapport aux événements tectoniques du Mésozoïque et du Cénozoïque (ici).

Dans ce contexte, et en remontant le temps, il faut noter l’individualisation, dès l’Ordovicien, de la péninsule antarctique avec des montagnes de plus de 3200 m d’altitude constituant aujourd’hui la région la plus au nord de l’Antarctique occidental et s’étendant au-delà du cercle polaire. Cette chaîne de montagnes prolonge les Andes de l’Amérique du Sud dans la continuité d’une dorsale sous-marine caractérisée par un gradient géothermique élevé (voir plus loin). Ainsi on voit que l’Antarctique, depuis longtemps et encore aujourd’hui, participe à un jeu de tectonique des plaques encore active avec des effets locaux (notamment variations du  gradient géothermique).Ce gradient géothermique est un élément important à prendre en considération dans la dynamique glaciaire car il favorise la fonte et ensuite le glissement des glaces.

Notons que Arctowski (in Fogg 1992) avait déjà suggéré en 1901 que les Andes étaient présentes dans la pointe nord de la péninsule antarctique (Graham Land) .

3.2. Englacement de la plaque Antarctique

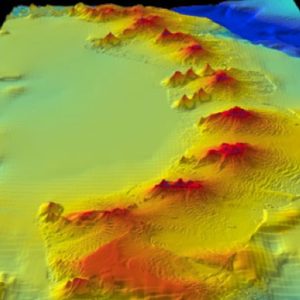
Fig. 16 : Image des fonds marins d’une chaîne de 800 km de long de plusieurs volcans actifs de 1000 m de haut situés à proximité de la partie nord du continent antarctique. D’après Kamis, 2016.

POLAR COLD TO GRIP ALL OF AUSTRALIA: FORECASTS CALL FOR COLDEST APRIL DAYS IN A QUARTER OF A CENTURY

by Cap Allon , April 27, 2020 in Electroverse


The mainstream media won’t give a toss, but the ENTIRE Aussie continent is set for an early, bone-chilling taste of winter as a meridional jet stream flow (brought on by historically low solar activity) kicks brutal Antarctic air anomalously far north.

On Thursday and Friday this week, the maximum temperature in Melbourne –for example– is forecast to plummet to the lowest recorded level in April since 1996 (solar minimum of cycle 22) — a chilly 13C (55.3F)

Don’t fall for bogus, warm-mongering political agendas — the COLD TIMES are returning in line with historically low solar activitycloud-nucleating Cosmic Rays, and a meridional jet stream flow.

Even NASA agrees, in part at least, with their forecast for this upcoming solar cycle (25) revealing it will be “the weakest of the past 200 years,” with the agency correlating previous solar shutdowns to prolonged periods of global cooling here.

Solar Cycle 25 Has Started

by D Archibald, April 22, 2020 in WUWT


The heliospheric current sheet has flattened meaning that Solar Cycle 24 is over and we are now in Solar Cycle 25.

Figure 1: Heliospheric current sheet tilt angle 1976 -2020

The solar cycle isn’t over until the heliospheric current sheet has flattened. The data is provided by the Wilcox Solar Observatory at Stanford University. There were no observations from about 19 December to 5 February; so the values in between have been interpolated from the rotations before and after.

Systemic Misuse of Scenarios in Climate Research and Assessment

by Pielke R & Richtie J, April 21, 2020


Abstract

Climate science research and assessments have misused scenarios for more than a decade. Symptoms of this misuse include the treatment of an unrealistic, extreme scenario as the world’s most likely future in the absence of climate policy and the illogical comparison of climate projections across inconsistent global development trajectories. Reasons why this misuse arose include (a) competing demands for scenarios from users in diverse academic disciplines that ultimately conflated exploratory and policy relevant pathways, (b) the evolving role of the Intergovernmental Panel on Climate Change – which effectively extended its mandate from literature assessment to literature coordination, (c) unforeseen consequences of employing a nuanced temporary approach to scenario development, (d) maintaining research practices that normalize careless use of scenarios in a vacuum of plausibility, and (e) the inherent complexity and technicality of scenarios in model-based research and in support of policy. As a consequence, the climate research community is presently off-track. Attempts to address scenario misuse within the community have thus far not worked. The result has been the widespread production of myopic or misleading perspectives on future climate change and climate policy. Until reform is implemented, we can expect the production of such perspectives to continue. However, because many aspects of climate change discourse are contingent on scenarios, there is considerable momentum that will make such a course correction difficult and contested – even as efforts to improve scenarios have informed research that will be included in the IPCC 6th Assessment.

Keywords: climate, scenarios, assessment, research integrity

Editorial: Climate Impacts on Glaciers and Biosphere in Fuego-Patagonia

by C. Schneider et al., April 2020 in FrontierEarthScience


The regional climate in Southernmost South America is heavily influenced by the proximity to the oceans. This generates rather weak seasonal cycles with cool to cold summers and moderate to cold winters, especially on the western Pacific side. Slightly more pronounced, continental seasonal cycles are observed in the East of the Andes. While annual mean air temperatures across the region are decreasing from North to South precipitation patterns show very pronounced east-west gradients. The distinctive gradients in precipitation are caused by the north-south striking mountain ranges of the Patagonian Andes, and the northwest-southeast stretching mountain chains of the Cordillera Darwin. Both mountain ranges enforce heavy precipitation on the west and southwest exposed flanks by uplift and dry foehn-like conditions on the leesides (e.g., Holmlund and Fuenzalida, 1995; Schneider et al., 2003; Rasmussen et al., 2007) which produces extremely high drying ratios (Escobar et al., 1992; Carrasco et al., 2002; Smith and Evans, 2007). At inter-annual to decadal time scales atmospheric teleconnections such as the El Niño Southern Oscillation (ENSO) (Schneider and Gies, 2004), Southern Annular Mode (SAM), and Pacific Decadal Oscillation (PDO) are influencing spatial and temporal patterns of both, precipitation and air temperature. For example, positive SAM modes (Garreaud, 2009; Weidemann, Sauter, Kilian et al.) and the PDO (Villalba et al., 2003) are associated with higher air temperatures. Langhamer et al. show that the source of precipitation in the Southern Andes also depends on these teleconnections.

An important aspect is that Patagonia and Tierra del Fuego, together with the sub-Antarctic islands are the only regions where direct proximity between Antarctica and land masses north of the Southern Ocean is given. Such linkages are for example explored with investigations by Hebel et al. on the biosphere and Oppedal et al. for the regional glacier history.

New Studies Show Cloud Cover Changes Have Driven Greenland Warming And Ice Melt Trends Since The 1990s

by K. Richard, April 20, 2020 in NoTricksZone


Scientists now acknowledge cloud cover changes “control the Earth’s hydrological cycle”, “regulate the Earth’s climate”, and “dominate the melt signal” for the Greenland ice sheet via modulation of absorbed shortwave radiation.  CO2 goes unmentioned as a contributing factor.


Solar Winds Hitting Earth Are Hotter Than They Should Be–Here’s Why

by M. McCrae, April 21, 2020 in ClimateChangeDispatch


Our planet is constantly bathed in the winds coming off the blistering sphere at the center of our Solar System.

But even though the Sun itself is so ridiculously hot, once the solar winds reach Earth, they are hotter than they should be – and we might finally know why.

We know that particles making up the plasma of the Sun’s heliosphere cool as they spread out. The problem is that they seem to take their sweet time doing so, dropping in temperature far slower than models predict.

“People have been studying the solar wind since its discovery in 1959, but there are many important properties of this plasma which are still not well understood,” says physicist Stas Boldyrev from the University of Wisconsin–Madison.

“Initially, researchers thought the solar wind has to cool down very rapidly as it expands from the Sun, but satellite measurements show that as it reaches the Earth, its temperature is 10 times larger than expected.”

The research team used laboratory equipment to study moving plasma, and now think the answer to the problem lies in a trapped sea of electrons that just can’t seem to escape the Sun’s grip.

The expansion process itself has long been assumed to be subject to adiabatic laws, a term that simply means heat energy isn’t added or removed from a system.

This keeps the numbers nice and simple but assumes there aren’t places where energy slips in or out of the flow of particles.

Unfortunately, an electron’s journey is anything but simple, shoved around at the mercy of vast magnetic fields like a roller coaster from Hell. This chaos leaves plenty of opportunities for heat to be passed back and forth.

Climate Change – Ebb and Flow of the Tide –Part 2 of 3

by Dr K. Kemm, April 16, 2020 in WUWT


The topic of global warming and climate change is far more scientifically complex than the public is led to believe.

Myriads of newspaper, magazine and TV items over decades have tended to simplify the science to the point at which the general public believes that it is all so simple that any fool can see what is happening. Public groups often accuse world leaders and scientists of being fools, if they do not instantly act on simple messages projected by individuals or public groups.

One often hears phrases like: ‘The science is settled.’ It is not. Even more worrying is that the reality of the correct science is actually very different to much of the simple public perception.

An additional complicating factor is that there are political groupings wanting to change the world social order and who are using the climate change issue as a vehicle to achieve these objectives. They want the ‘science’ to say what they want it to say and are not interested in the truth. Sections of the public, with noble good intentions, then frequently do not realize that they are being induced by such elements to unwittingly support a political agenda, which in reality is unrelated to the climate issue.

I found myself in an informal social debate on these topics, with some people getting rather heated. Attempts to cool the conversation temperature were not so successful. The political aspects of the climate change issue, as always, entered into the discussion. Points like: ‘saving mankind from disaster’ were made with much emotion, and UN and various government political votes on the science were referred to, as if a political vote settled the scientific facts.

Sadly, so much of the climate debate is the result of votes and not of sound science, as determined by scientific methodology and protocol which has been developed over centuries.


Continuer la lecture de Climate Change – Ebb and Flow of the Tide –Part 2 of 3

GREENLAND HAS GAINED 27+ GIGATONS OF SNOW AND ICE OVER THE PAST 5 DAYS ALONE — MSM SILENT

by Cap Allon, April, 2020 in Electroverse


Despite decades of doom-and-gloom prophecies, Greenland’s Ice Sheet is currently GAINING monster amounts of “mass” — 27 gigatons over the past 5 days alone (April 14 – 18, 2020).

Crucial to the survival of a glacier is its surface mass balance (SMB)–the difference between accumulation and ablation (sublimation and melting). Changes in mass balance control a glacier’s long-term behavior, and are its most sensitive climate indicators (wikipedia.org).

On the back of substantial SMB gains over the past few years, the Greenland ice sheet looks set to continue that trend in 2019-20. From April 14 through April 18, 2020, the world’s largest island added a monster 27+ gigatons to its ice sheet. According to climate alarmists, this simply shouldn’t be happening in a warming world. In fact, it might as well not be happening as developments like these NEVER receive MSM attention, meaning alarmists are NEVER privy to the full and unalarming picture…

‘Arctic April’ Grips N. America Breaking Hundreds Of Cold Records

by Cap Allon, April 16, 2020 in ClimateChangeDispatch


Record cold and snowfall hit many parts of North America over the Easter weekend, continuing what has so far been a largely Arctic April.

Records were toppled across many U.S. states, with Montana, Iowa, South Dakota, and Colorado seemingly worst hit.

A winter storm system moved through Iowa on Sunday delivering between three inches and a foot to the majority of locations — several northern Iowa towns saw all-time records tumble:

The 3.7 inches that fell at Sioux Gateway Airport broke the record for April 12th; it also made it the second-highest Easter snowfall ever behind the 4.7 inches during Easter 1929.

The town of Ringsted in Emmet County (also Iowa) came in with a record-busting 11 inches.

Robert “Lightning” Petersen was the man to log the accumulation — he uses his back yard measuring equipment to keep track of snow and rainfall. He works in concert with the National Weather Service out of Johnston.

UK State Of The Climate Report 2019

by P. Homewood, April 16, 2020 In NotaLotofPeopleKnowThat


London, 16 April: The floods that affected northern England in the autumn of 2019 were nothing out of the ordinary. That’s according to a new review of the UK’s 2019 weather.

Author Paul Homewood says that although rainfall in the region was high, it has been exceeded several times in the past, right back to the 19th century.

Key findings

* After a rising trend between the 1980s and early 2000s, temperature trends have stabilised in the UK.

* Heatwaves are not becoming more intense, but extremely cold weather has become much less common.

* There is little in the way of long-term trends in rainfall in England and Wales.

* Sea-level rise around British coasts is not accelerating.

The UK’s Weather in 2019: More of the same, again (PDF)

Melting Glaciers Uncover Medieval Artefacts In Norway

by P. Homewood, April 16, 2020 in NotaLotofPeopleKnowThat


Melting glaciers in Norway have revealed ancient artefacts dropped by the side of a road more than 1,000 years ago.

Clothes, tools, equipment and animal bone have been found by a team at a lost mountain pass at Lendbreen in Norway’s mountainous region.

A haul of more than 100 artefacts at the site includes horseshoes, a wooden whisk, a walking stick, a wooden needle, a mitten and a small iron knife.

The team also found the frozen skull of an unlucky horse used to carry loads that did not make it over the ice.

The objects that were contained in ice reveal that the pass was used in the Iron Age, from around AD 300 until the 14th century.

Activity on the pass peaked around AD 1000 and declined after the black death in the 1300s, due as well to economic and climate factors.

The researchers say the melting of mountain glaciers due to climate change has revealed the historical objects, with many more to come.

https://www.dailymail.co.uk/sciencetech/article-8224817/Melting-ice-reveals-lost-Viking-mountain-path.html


Unfortunately neither the journalist nor the scientists seem to be capable of adding 2+2!


The existence of the Medieval Warm Period in Norway, followed by glacial advance in the Little Ice Age has been long known about, as HH Lamb wrote in 1982: