by Science, Climat et Energie, 27 mars 2019
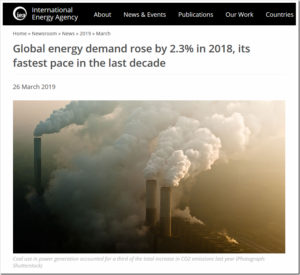
Selon le dernier rapport de l’IEA, la consommation d’énergie mondiale a augmenté de 2,3% en 2018 ce qui représente la plus forte augmentation des dix dernières années. Le gaz naturel fut le plus consommé et représente 45% de l’augmentation de la consommation totale d’énergie.
Suite à cette augmentation de consommation d’énergie les émissions de CO2 se sont accrues de 1,7% pour atteindre 33,1 Gt en 2018. Près d’un tiers de ces émissions provient des centrales de charbon, surtout celles de la Chine.
Il faut noter que les émissions de CO2 en Chine ont augmenté de 2,5%, ou 230 Mt, pour atteindre 9,5 Gt. Un bond de plus de 5% de la production d’électricité à partir de centrales au charbon a entraîné une augmentation des émissions de 250 Mt, ce qui a plus que compensé l’impact de la baisse de l’utilisation du charbon en dehors du secteur de l’énergie.
Pour comparer…la Belgique émet 115 Mt de CO2.
DONC…l’augmentation des émissions en Chine dues au charbon en 2018 représente plus du double de toutes les émissions de CO2 de la Belgique.