Archives de catégorie : climate-debate

Cycle du carbone, l’éclairage de trois nouvelles publications

by Uzbek, 11 septembre 2018 in Climat,Environnemen,Energie


Trois nouvelle études publiées en août 2018 apportent un éclairage nouveau sur le cycle du carbone. La première, publiée dans la revue Nature [1] montre que le taux de croissance du CO2  dans l’atmosphère est très sensible aux changements observés dans le stockage de l’eau terrestre. Les deux autres publiées respectivement dans Nature Geoscience [2] et dans Nature [3] montrent une tendance à l’augmentation du puits de carbone terrestre grâce notamment  aux modifications de l’usage des sols sous l’influence des activités humaines.

Addressing on Abrupt Global Warming, Warming Trend Slowdown and Related Features in Recent Decades

by Indriani Roy, September28,  2018 in FrontiersinEarthScience


  • College of Engineering, Mathematics and Physical Sciences, University of Exeter, Exeter, United Kingdom

The puzzle of recent global warming trend slowdown has captured enough attention, though the underlying cause is still unexplained. This study addresses that area segregating the role of natural factors (the sun and volcano) to that from CO2 led linear anthropogenic contributions. It separates out a period 1976–1996 that covers two full solar cycles, where two explosive volcanos erupted during active phases of strong solar cycles. The similar period also matched the duration of abrupt global warming. It identifies that dominance of Central Pacific (CP) ENSO and associated water vapor feedback during that period play an important role. The possible mechanism could be initiated via a preferential alignment of NAO phase, generated by explosive volcanos. Inciting extratropical Rossby wave to influence the Aleutian Low, it has a modulating effect on CP ENSO. Disruption of Indian Summer Monsoon and ENSO during the abrupt warming period and a subsequent recovery thereafter can also be explained from that angle. Interestingly, CMIP5 model ensemble, and also individual models, fails to comply with such observation. It also explores possible areas where models miss important contributions due to natural drivers.

Daily Averages? Not So Fast…

by Kip Hansen, October 2, 2018 in WUWT


In the comment section of my most recent essay concerning GAST (Global Average Surface Temperature) anomalies (and why it is a method  for Climate Science to trick itself) — it was brought up [again] that what Climate Science uses for the Daily Average temperature from any weather station is not, as we would have thought, the average of the temperatures recorded for the day (all recorded temperatures added to one another divided by the number of measurements) but are, instead, the Daily Maximum Temperature (Tmax) plus the Daily Low Temperature (Tmin) added and divided by two.  It can be written out as (Tmax + Tmin)/2.

Anyone versed in the various forms of averages will recognize the latter is actually the median of  Tmax and Tmin — the midpoint between the two …

Wildfire aerosols remain longer in atmosphere than expected

by Michigan Technological University, October 2, 2018 in ScienceDaily


… “Wildfires are such a huge source of aerosol in the atmosphere with a combination of cooling and warming properties, that understanding the delicate balance can have profound consequences on how accurately we can predict future changes,” says Claudio Mazzoleni, professor of physics, and one of the authors of the paper.

As wildfires increase in size and frequency in the world’s arid regions, more aerosol particles could be injected into the free troposphere where they are slower to oxidize, contributing another important consideration to the study of atmospheric science and climate change.

1989 UN report: ‘By 2000, coastal cities will be underwater’

by David Hilton, September 30, 2018 in EndtimesHerald


By the year 2000, according to the 1989 story:

Coastal flooding and crop failures would create an exodus of ″eco- refugees,′ ′ threatening political chaos, said Noel Brown, director of the New York office of the U.N. Environment Program, or UNEP.

He said governments have a 10-year window of opportunity to solve the greenhouse effect before it goes beyond human control.

Well we’re here in 2018, Noel, it’s nearly October, and I’m sitting here in South-East Queensland at midday in a jacket because it’s cold.

LES EPOUVANTABLES CONSEQUENCES DU RECHAUFFEMENT CLIMATIQUE (2)

by Jo Moreau, October 2, 2018 in Belgotopia


Ceux qui me font l’honneur (et le plaisir) de suivre ma page Facebook « belgotopia » profitent de ma rubrique : « Dans l’hilarante série : les délires climatiques », qui distille à doses homéopathiques la litanie des épouvantables conséquences du réchauffement (changement) climatique qui nous menace.

Celles-ci sont extraites soit de médias, soit de revues scientifiques dont on ne peut décemment mettre le sérieux en doute, et contribuent à entretenir la peur parmi nos populations. Et ces études, ne l’oublions pas, sont financées par l’argent public, soit le vôtre et le mien.

Les cent premières furent rassemblées dans un billet, que je vous engage vivement à (re)consulter :

https://belgotopia.com/2017/06/02/les-epouvantables-consequences-du-changement-climatique/

Voici donc les cinquante suivantes, et j’en ai encore un nombre considérable en réserve, car nous sommes soumis à une véritable avalanche de constatations ou de prédictions terrifiantes !

Alors, vous aussi, affolez-vous sans réserve !

Hunger Stones and Tree Ring evidence suggests solar cycle influence on climate

by Francis Tucker Manns Ph.D., September 30, 2018 in WUWT


Conclusions

Extreme weather events, mostly drought are considered, but floods as well, correspond to solar minima in more than 75% (18 out of 24 of the cases known).

Current concentrations of carbon dioxide cannot be invoked for extreme weather in the historical past.

The sun controls the climate of the Earth.

During summer it is inevitable that lightning storms ignite fires and produce heavy rain. The intensity of what we have come to call extreme weather is magnified by standing Rossby waves.

Sunspot research tends to emphasize sunspot peaks and sunspot numbers; more may be gained by evaluating trough events and peak and trough frequencies.

NASA: The chill of solar minimum is being felt in our atmosphere – cooling trend seen

by Anthony Watts, September 28, 2018 in WUWT


These results come from the SABER instrument onboard NASA’s TIMED satellite. SABER monitors infrared emissions from carbon dioxide (CO2) and nitric oxide (NO), two substances that play a key role in the energy balance of air 100 to 300 kilometers above our planet’s surface. By measuring the infrared glow of these molecules, SABER can assess the thermal state of gas at the very top of the atmosphere–a layer researchers call “the thermosphere.”

When the thermosphere cools, it shrinks, literally decreasing the radius of Earth’s atmosphere. This shrinkage decreases aerodynamic drag on satellites in low-Earth orbit, extending their lifetimes. That’s the good news. The bad news is, it also delays the natural decay of space junk, resulting in a more cluttered environment around Earth.

IT’S ALL OVER: EU ABANDONS NEW 2030 CLIMATE TARGET

by Deutsche Press Agentur, September 28, 20108 in GWPF


Contrary to what has been announced, Cañete has not submitted the proposal to the EU member states, the German Press Agency in Brussels has learned. The idea was met with opposition by, among others, German Chancellor Angela Merkel and the German industry. Other EU countries also rejected it. Global climate policy is in crisis since US President Donald Trump quit the Paris climate agreement of 2015.

See also here

Quakes, Pollution and Flaming Fauces : The UK media on shale gas.

by Andrew Montford, September 27, 2018 in GWPFbriefing34


The briefing, published by the Global Warming Policy Foundation, focuses on the output of the BBC and the Guardian, and outlines many examples of biased coverage.

However, it wasn’t always this way, as author Andrew Montford explains:

“When shale gas first came on the scene, coverage was very positive: gas was seen as a low-carbon alternative to coal. It was only when it looked as though it would price renewables out of the market that the scare stories and bias began”.

Now at least 10 years with sea ice at 2050-like levels yet polar bears are still abundant

by Polar Bear Science, September 27, 2018


We’ve hit the seasonal Arctic sea ice minimum for this year, called this morning by US NSIDC for 19th and 23rd of Septmeber: 4.59 mkm2, the same extent as 2008 and 2010. This is not a “ho-hum” year for polar bears: it means that since 2007, they have triumphed through 10 or 11 years1 with summer ice coverage below 5.0 mkm2 —  levels that in 2007 were expected to cause catastrophic declines in numbers.

Sea Level Speculation Irresponsibly Threatens Property Owners

by Jim Steele, September 26, 2018 in WUWT


The suggested steady 3.3 mm/year rise since 1992 conflicted with CO2-driven model predictions of acceleration. So, based on the difficulties of calibrating altimetry with tide gauge data, various researchers claimed satellite drift and biases had over-estimated early estimates of sea level rise from 1994-2002. Various adjustments were then evoked, and varying rates of sea level rise published. New global sea level estimates rose at an accelerating rate from 1.8 in 1993 to 3.9 mm/yr today, others at 2.2 mm/yr in 1993 to 3.3 mm/yr in 2014, yet others found satellite adjustments lowered the average rate of sea level rise to 2.6 mm/yr over that same period. Elsewhere Harvard geophysicists were analyzing the effects of mass change on the earth’s rotation and wobble and were disturbed by the misfit between geophysical observations and sea level estimates. They argued that only if 20thcentury sea level rise was limited to 1.2 mm/yr could there be a good fit with geophysical expectations.

Another Dis-alarming Analysis of Arctic Sea Ice David Middleton / 17 hours ago September 26, 2018

by David Middleton, September 26, 2018 in WUWT


Anthony recently posted an excellent Arctic sea ice analysis by Ron Clutz.  In a similar vein, I decided to look at Arctic sea ice from a couple of other dis-alarming perspectives.

We keep hearing about the Arctic being ice-free anytime from next month up until a continuously rolling forward decade or so.  One question that has to be answered is:

What does ice-free mean?

When does ice-free mean ice-free?

First, we need to clarify what exactly an “ice-free” Arctic summer is.

By “ice-free”, scientists usually mean a sea ice extent of less than one million square kilometres, rather than zero sea ice cover.

–Dr Alexandra Jahn, Assistant Professor in the Department of Atmospheric and Oceanic Sciences and Fellow at the Institute of Arctic and Alpine Research at the University of Colorado. Carbon Brief, August 25, 2016.

The Shameful Politicization Of Hurricanes

by H.S. Burnett, September 26, 2018 in ClimateChangeDispatch


Here are several facts that dispel these myths.

First, although the Atlantic hurricane season is not over yet, thus far, the number of hurricanes occurring this year is below average.

During a typical six-month Atlantic hurricane season, 12 named storms form, six become hurricanes, and three of those become major hurricanes – meaning Category 3 or higher.

This season, 10 named storms have formed in the Atlantic Basin, three of which became hurricanes.

Two other hurricanes briefly became minor storms off the west coast of Africa – and only Florence became a major hurricane.

Furthermore, only one has made landfall in the United States: Florence.

Before the above-average Atlantic hurricane season of 2017, the United States experienced the longest period in recorded history, nine years, without a major hurricane (Category 3 or higher) striking the country.

The Great Global Warming Hoax?

by The Middlelbury Community Network, September 2018

Editor’s Introductory Note: Our planet has been slowly warming since last emerging from the “Little Ice Age” of the 17th century, often associated with the Maunder Minimum.  Before that came the “Medieval Warm Period“, in which temperatures were about the same as they are today.  Both of these climate phenomena are known to have occurred in the Northern Hemisphere, but several hundred years prior to the present, the majority of the Southern Hemisphere was primarily populated by indigenous peoples, where science and scientific observation was limited to non-existent.  Thus we can not say that these periods were necessarily “global”.

However, “Global Warming” in recent historical times has been an undisputable fact, and no one can reasonably deny that.

….

Summary – Exactly what have we learned here?

1.  The “Greenhouse Effect” is a natural and valuable phenomenon, without which, the planet would be uninhabitable.2.  Modest Global Warming, at least up until 1998 when a cooling trend began, has been real.

3.  CO2 is not a significant greenhouse gas; 95% of the contribution is due to Water Vapor.

4.  Man’s contribution to Greenhouse Gasses is relatively insignificant.  We didn’t cause the recent Global Warming and we cannot stop it.

5.  Solar Activity appears to be the principal driver for Climate Change, accompanied by complex ocean currents which distribute the heat and control local weather systems.

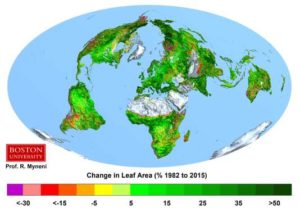
6.  CO2 is a useful trace gas in the atmosphere, and the planet would actually benefit by having more, not less of it, because it is not a driver for Global Warming and would enrich our vegetation, yielding better crops to feed the expanding population.

7.  CO2 is not causing global warming, in fact, CO2 is lagging temperature change in all reliable datasets.  The cart is not pulling the donkey, and the future cannot influence the past.

8.  Nothing happening in the climate today is particularly unusual, and in fact has happened many times in the past and will likely happen again in the future.

9.  The UN IPCC has corrupted the “reporting process” so badly, it makes the oil-for-food scandal look like someone stole some kid’s lunch money.  They do not follow the Scientific Method, and modify the science as needed to fit their predetermined conclusions.  In empirical science, one does NOT write the conclusion first, then solicit “opinion” on the report, ignoring any opinion which does not fit their predetermined conclusion while falsifying data to support unrealistic models.

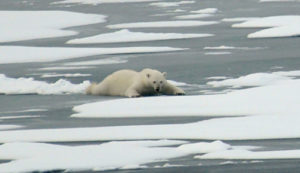
10.  Polar Bear populations are not endangered, in fact current populations are healthy and at almost historic highs.  The push to list them as endangered is an effort to gain political control of their habitat… particularly the North Slope oil fields.

11.  There is no demonstrated causal relationship between hurricanes and/or tornadoes and global warming.  This is sheer conjecture totally unsupported by any material science.

12.  Observed glacial retreats in certain select areas have been going on for hundreds of years, and show no serious correlation to short-term swings in global temperatures.

13.  Greenland is shown to be an island completely surrounded by water, not ice, in maps dating to the 14th century.  There is active geothermal activity in the currently “melting” sections of Greenland.

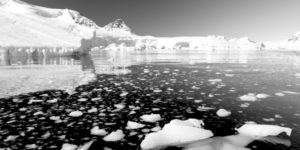
14.  The Antarctic Ice cover is currently the largest ever observed by satellite, and periodic ice shelf breakups are normal and correlate well with localized tectonic and geothermal activity along the Antarctic Peninsula.

15.  The Global Warming Panic was triggered by an artifact of poor mathematics which has been thoroughly disproved.  The panic is being deliberately nurtured by those who stand to gain both financially and politically from perpetuation of the hoax.

16.  Scientists who “deny” the hoax are often threatened with loss of funding or even their jobs.

17.  The correlation between solar activity and climate is now so strong that solar physicists are now seriously discussing the much greater danger of  pending global cooling.

18.  Biofuel hysteria is already having a disastrous effect on world food supplies and prices, and current technologies for biofuel production consume more energy than the fuels produce.

19.  Global Warming Hysteria is potentially linked to a stress-induced mental disorder.

20. In short, there is no “climate crisis” of any kind at work on our planet.

Retracing Antarctica’s glacial past

by Louisiana State University, September 25, 2018 in ScienceDaily


More than 26,000 years ago, sea level was much lower than it is today partly because the ice sheets that jut out from the continent of Antarctica were enormous and covered by grounded ice — ice that was fully attached to the seafloor. As the planet warmed, the ice sheets melted and contracted, and sea level began to rise. Researchers have discovered new information that illuminates how and when this global phenomenon occurred.

More recently in 2002, in the northern part of Antarctica called the Antarctic Peninsula, the Larsen Ice Shelf collapsed. The collapse of this ice shelf quickly led to inland glaciers buttressed by the Larsen Ice Shelf to break up and melt. Scientists have thought that a similar process could have occurred when the Ross Ice Shelf collapsed thousands of years ago in the West Antarctic Ice Sheet.

However, Bart and colleagues from the University of South Florida, Auburn University and the Polish Academy of Sciences found that there was a centuries-long delay from when the Ross Ice Shelf collapsed and the grounded ice began to contract. In the Ross Sea, the delay was between 200 to 1,400 years later. This new information adds a layer of complexity for sea level rise computer simulations and predictions.

The ‘Trick’ of Anomalous Temperature Anomalies

by Kip Hansen, September 25, 2018 in WUWT


It seems that every time  we turn around, we are presented with a new Science Fact that such-and-so metric — Sea Level Rise, Global Average Surface Temperature, Ocean Heat Content, Polar Bear populations, Puffin populations — has changed dramatically — “It’s unprecedented!” — and these statements are often backed by a graph illustrating the sharp rise (or, in other cases, sharp fall) as the anomaly of the metric from some baseline.  In most cases, the anomaly is actually very small and the change is magnified by cranking up the y-axis to make this very small change appear to be a steep rise (or fall).

A Test of the Tropical 200- to 300-hPaWarming Rate in Climate Models

by R. McKitrick and J. Christy, July 6, 2018 in AGU100


Abstract
Overall climate sensitivity to CO2
doubling in a general circulation model results from a complex
system of parameterizations in combination with the underlying model structure. We refer to this as the modelsmajor hypothesis, and we assume it to be testable. We explain four criteria that a valid test should meet: measurability, specificity, independence, and uniqueness. We argue that temperature change in the
tropical 200- to 300-hPa layer meets these criteria. Comparing modeled to observed trends over the past
60 years using a persistence-robust variance estimator shows that all models warm more rapidly than
observations and in the majority of individual cases the discrepancy is statistically significant. We argue that
this provides informative evidence against the major hypothesis in most current climate models.

The BBC’s Naive View of the UN’s Climate Machine

by Donna Laframboise, September25, 2018 in BigPictureNews


SPOTLIGHT: Bureaucracies put their trust in other bureaucracies.

BIG PICTURE: A few weeks back, Joanne Nova perfectly captured the position of the British Broadcasting Corporation (BBC) regarding the scandalous UN entity known as the Intergovernmental Panel on Climate Change (IPCC).

A recent internal document gives BBC journalists advice about how to report on climate matters. In Nova’s words, it declares that the “IPCC is God, can not be wrong.”

The document’s exact words:

30 YEARS AGO OFFICIALS PREDICTED THE MALDIVES WOULD BE SWALLOWED BY THE SEA. IT DIDN’T HAPPEN

by Michael Bastasch, September 21, 2018 in TheDailyCaller


Environmental officials warned 30 years ago the Maldives could be completely covered by water due to global warming-induced sea level rise.

That didn’t happen. The Indian Ocean did not swallow the Maldives island chain as predicted by government officials in the 1980s.

In September 1988, the Agence France-Presse (AFP) reported a “gradual rise in average sea level is threatening to completely cover this Indian Ocean nation of 1196 small islands within the next 30 years,” based on predictions made by government officials.

Then-Environmental Affairs Director Hussein Shihab told AFP “an estimated rise of 20 to 30 centimetres in the next 20 to 40 years could be ‘catastrophic’ for most of the islands, which were no more than a metre above sea level.”

Arctic Ice Made Simple

by Ron Clutz, September 22, 2018 in ScienceMatters


People are overthinking and over-analyzing Arctic Ice extents, and getting wrapped around the axle (or should I say axis).  So let’s keep it simple and we can all readily understand what is happening up North.

I will use the ever popular NOAA dataset derived from satellite passive microwave sensors.  It sometimes understates the ice extents, but everyone refers to it and it is complete from 1979 to 2017.  Here’s what NOAA reports (in M km2):

“There Has Never Been An Energy Transition”

by David Middleton, September 20, 2018T in WUWT


One of my favorite sayings is, “We didn’t leave the Stone Age because we ran out of stones.”  Technically we never left the Stone Age because we use more rocks now than we did in the Stone Age.

And we never left the “Wood Age.”  There was no energy transition from biomass (wood) to fossil fuels. Coal piled on top of biomass, oil piled on top of coal and natural gas piled on top of oil