Archives de catégorie : climate and geology

Newly Discovered Greenland Plume Drives Thermal Activities in the Arctic

by C. Rotter, Dec 29, 2020  in WUWT


A team of researchers understands more about the melting of the Greenland ice sheet. They discovered a flow of hot rocks, known as a mantle plume, rising from the core-mantle boundary beneath central Greenland that melts the ice from below.

The results of their two-part study were published in the Journal of Geophysical Research.

“Knowledge about the Greenland plume will bolster our understanding of volcanic activities in these regions and the problematic issue of global sea-level rising caused by the melting of the Greenland ice sheet,” said Dr. Genti Toyokuni, co-author of the studies.

The North Atlantic region is awash with geothermal activity. Iceland and Jan Mayen contain active volcanoes with their own distinct mantle plumes, whilst Svalbard – a Norwegian archipelago in the Arctic Ocean – is a geothermal area. However, the origin of these activities and their interconnectedness has largely been unexplored.

The research team discovered that the Greenland plume rose from the core-mantle boundary to the mantle transition zone beneath Greenland. The plume also has two branches in the lower mantle that feed into other plumes in the region


Newly discovered Greenland plume drives thermal activities in the Arctic

by Tohoku University, Dec 7, 2020 in ScienceDaily


A team of researchers understands more about the melting of the Greenland ice sheet. They discovered a flow of hot rocks, known as a mantle plume, rising from the core-mantle boundary beneath central Greenland that melts the ice from below.

The results of their two-part study were published in the Journal of Geophysical Research.

“Knowledge about the Greenland plume will bolster our understanding of volcanic activities in these regions and the problematic issue of global sea-level rising caused by the melting of the Greenland ice sheet,” said Dr. Genti Toyokuni, co-author of the studies.

The North Atlantic region is awash with geothermal activity. Iceland and Jan Mayen contain active volcanoes with their own distinct mantle plumes, whilst Svalbard — a Norwegian archipelago in the Arctic Ocean — is a geothermal area. However, the origin of these activities and their interconnectedness has largely been unexplored


Claim: The climate changed rapidly alongside sea ice decline in the north

by University of Copenhagen, Dec 6, 2020 in WUWT


Researchers from the Niels Bohr Institute, University of Copenhagen have, in collaboration with Norwegian researchers in the ERC Synergy project, ICE2ICE, shown that abrupt climate change occurred as a result of widespread decrease of sea ice. This scientific breakthrough concludes a long-lasting debate on the mechanisms causing abrupt climate change during the glacial period. It also documents that the cause of the swiftness and extent of sudden climate change must be found in the oceans.

Scientific evidence for abrupt climate change in the past finally achieved

During the last glacial period, app. 10,000 – 110,000 years ago the northern hemisphere was covered in glacial ice and extensive sea ice, covering the Nordic seas. The cold glacial climate was interrupted by periods of fast warmup of up to 16.5 degrees Celsius over the Greenland ice sheet, the so called Dansgaard Oeschger events (D-O).

These rapid glacial climate fluctuations were discovered in the Greenland ice core drillings decades ago, but the cause of them have been hotly contested. D-O events are of particular significance today as the rate of warming seems to be very much like what can be observed in large parts of the Arctic nowadays. The new results show that the abrupt climate change in the past was closely linked to the quick and extensive decline in sea ice cover in the Nordic seas. Very important knowledge as sea ice is presently decreasing each year.

“Our, up until now, most extensive and detailed reconstruction of sea ice documents the importance of the rapid decrease of sea ice cover and the connected feedback mechanisms causing abrupt climate change”, says Henrik Sadatzki, first author of the study.

Sediment core and ice core data were combined in order to achieve the result

In Geological Terms, Today’s Atmospheric CO2 Concentrations Are Still Uncomfortably Low

by P. Gosselin, Dec 5, 2020 in NoTricksZone


Under 180 ppm atmospheric CO2 concentration, life on earth begins to die.

The earth came very close to that point not long ago during the Ice Ages (20,000 years ago). Then the planet warmed naturally, and an increase in atmospheric CO2 to over 200 ppm followed (new study here).

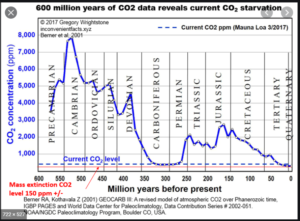
The earth saw CO2 levels of close to 8000 ppm in the past, i.e. about 20 times more than today. The following chart shows the earth’s atmospheric CO2 concentrations for the past 600 million years.

Today, thanks in large part to mankind, concentrations have risen to over 400 ppm, yet historically this remains at the very low end of the scale compared to the thousands of ppm seen naturally earlier in history.

Greening planet

Today, definitely a safer level would be near 1000 ppm. Studies unanimously show plant growth at these higher levels is far enhanced. Already today we see clear evidence the planet is greening Zhu et al. (2016), in part due to the fertilizations taking place through human emissions:

New Paleoclimatology Finding Shows Earth’s Climate Was Typically Warmer than Today

by H.S. Sterling, Dec2, 2020 in WUWT


Archaeologists have published a new paper in The HoloceneDOI: 10.1177/0959683620972775 that confirms what previous research has shown: numerous periods during recent history have been as warm as or warmer than the present.

The press release was covered in The New Scientist, “Climate change has revealed a huge haul of ancient arrows in Norway,”  and discusses the findings of researchers from the Universities of Cambridge, Oslo, and Bergen. The researchers discovered a “treasure trove” of arrows, arrowheads, clothing, and other artifacts, recently uncovered by a receding ice in a mountainous region of southern Norway. The oldest arrows and artifacts date from around 4100 BC. The youngest artifacts date from approximately AD 1300, at the end of the Medieval Warm Period. Because present temperatures are only now exposing some of the artifacts were deposited when no ice covered the ground, temperatures were clearly warmer during the many periods when artifacts were deposited.

Along with the arrows and other artifacts, the researchers found nearly 300 specimens of reindeer antler and bone exposed by receding ice. Because reindeer presently frequent the area, the archaeologists say they are confident the area has served as an important hunting ground, off and on, for millennia.

The fact that artifacts were found from several different periods separated by hundreds and thousands of years in time indicates the ice and snow in the region has expanded and receded several times over the current interglacial period.

Elsewhere in Norway, scientists also recently uncovered what they have labeled a “Viking highway,” a route the ancient peoples inhabiting the region used to travel regularly. The route had for approximately 2,000 years been covered by snow and ice that expanded as the region’s climate shifted from a relatively warm period, comparable to present temperatures, to a colder period during which “permanent” thick snow and ice cover formed. This erected the equivalent of a “highway closed” sign.

Editorial: Deep Carbon Science

by D. Cardace et al., Nov 12, 2020 in Front.Earth.Sci.


Editorial on the Research Topic
Deep Carbon Science

Our understanding of the slow, deep carbon cycle, key to Earth’s habitability is examined here. Because the carbon cycle links Earth’s reservoirs on nano- to mega-scales, we must integrate geological, physical, chemical, biological, and mathematical methods to understand objects and processes so small and yet so vast. Here, we profile current research in the physical chemistry of carbon in natural and model systems, processes ongoing in the deepest portions of planets, and observations of carbon utilization by the deep biosphere. The relationships between the carbon cycle and planetary habitability are undeniable, forming a conceptual anchor to all work in deep carbon science.

Carbon minerals respond to changing pressures, temperatures, and geochemical conditions. The geologic record preserves evidence of transitional periods at the submicroscopic to regional landscape scales, and demonstrates interplay between carbon-bearing phases and the biosphere. In a new review, Morrison et al. (2020) cast a retrospective look through deep time and call for emerging approaches to clarify the coevolution of the biosphere and geosphere.

Critical to transformations of Earth’s carbon inventory over time are indomitable tectonics – which influence Earth’s surface environment, weathering, metamorphism, magmatism, and volcanism. The slow, deep (endogenous) carbon cycle refines and re-distributes carbon within Earth. In fact, over the 200-million-year-long time scale, important tectonic controls on carbon cycling emerge (Wong et al., 2019). Wong et al. (2019) document the spatiotemporal evolution of fluxes inferred from plate tectonic reconstructions, and highlight CO2 fluxes from continental rift settings post-Pangea. The volcanic flux of CO2 has been successfully reconstructed by direct study of CO2 flux through lakes and adjacent soils (Hughes et al., 2019), an important and often overlooked CO2 valve linking lithosphere, atmosphere, and hydrosphere. From perspectives rooted deeper in the tectonic system, the important roles that serpentinites play in the carbon cycle are evaluated in two senses: 1) serpentinite as a carbon vector to the deep mantle (Merdith et al., 2019), and 2) serpentine mud volcanoes as sites of carbon mobilization through organic acid release (Eickenbusch et al., 2019), in a Mariana Trench case study.

Continuer la lecture de Editorial: Deep Carbon Science

How ancient dust from the sea floor helps to explain climate history

by UNIVERSITY OF OLDENBURG, Nov 11, 2020 in WUWT


During the last Ice Age about 20,000 years ago, iron-containing dust acted as a fertilizer for marine phytoplankton in the South Pacific, promoting CO2 sequestration and thus the glacial cooling of the Earth. But where did the dust come from? Researchers led by Dr. Torben Struve, geoscientist at the University of Oldenburg, Germany, have investigated this open question of climate history, which is also relevant with respect to current climate change.

Using sediment cores from the sea floor, they found that a large part of the dust deposited in the southern South Pacific at that time had travelled an extremely long way. Up to 80 percent of the dust came from what is now north-west Argentina, from where it was transported almost completely around the globe by the prevailing westerly winds. After a voyage of up to 20,000 kilometres, it contributed significantly to the increased input of iron into the glacial South Pacific. The dust input from Australia, which dominates in the South Pacific today, played only a minor role. The research team has published these new insights into the mechanisms of natural iron input into the Southern Ocean in the journal Nature Communications.

“We have analysed the chemical fingerprint of the dust and compared it with geological data from several continents. This was laborious work, like a jigsaw puzzle,” says Struve, a post-doctoral scientist in the research group “Marine Isotope Geochemistry” at the University’s Institute for Chemistry and Biology of the Marine Environment (ICBM). The team included researchers from his group as well as colleagues from the Alfred Wegener Institute – Helmholtz Centre for Polar and Marine Research, Bremerhaven (Germany), and from Columbia University, New York (USA).

The cement for coral reefs

by University of Erlangen-Nuremberg  Nov 2020, in ScienceDaily


Coral reefs are hotspots of biodiversity. As they can withstand heavy storms, they offer many species a safe home, and at the same time, they protect densely populated coastal regions as they level out storm-driven waves. However, how can these reefs that are made up of often very fragile coral be so stable? A team of researchers from Friedrich-Alexander Universität Erlangen-Nürnberg (FAU) and the University of Bayreuth have now discovered that a very specific type of ‘cement’ is responsible for this — by forming a hard calcareous skeleton, coralline red algae stabilise the reefs, and have been doing so for at least 150 million years.

The wide variety of life they support is immediately apparent on images of tropical coral reefs. Their three-dimensional scaffolding provides a habitat for a large number of species. However, the skeletons of the coral are often so fragile that they would not be able to withstand heavy storms by themselves. Even if scientists have long suspected that coralline red algae provide support to reefs with their calcareous skeletons, this is the first time that this link has been proven.

Coralline red algae have been supporting coral reefs for at least 150 million years

The researchers from FAU and the University of Bayreuth were able to prove this supporting function by analysing more than 700 fossilised reefs from 150 million years of the Earth’s history. ‘The coralline red algae form a calcareous skeleton and cement the coral reefs together,’ explains Dr. Sebastian Teichert from the Chair of Palaeoenvironmental Research at FAU. ‘However, several crises over the course of millions of years have limited their capacity to do so.’

Successful adaptive strategies against plant grazers


3 More New Studies Show Modern Arctic Sea Ice Extent Is Greater Than Nearly Any Time In The Last 10,000 Years

by K. Richard, Oct 29, 2029 in NoTricksZone


For years scientists have been using biomarker evidence (IP25, PIP25) to reconstruct the Arctic’s sea ice history. The evidence shows modern (20th-21st century) Arctic sea ice is at its greatest extent since the Holocene began.

Scientists (Wu et al., 2020) have determined that from about 14,000 to 8,000 years ago, when CO2 lingered near 250 ppm, the Beaufort Sea (Arctic) was “nearly ice free throughout the year” (<0.2 PIP25) and ~4°C warmer than today in winter.

With CO2 at ~400 ppm, this region is 70-100% ice-covered (>0.8 PIP25) for all but 1-2 summer months in the modern (1988-2007) era.

….

“Where’s the sea ice?” Right where it’s been for most of the Holocene.

by D. Middleton, Oct 30, 2020 in WUWT


This is sort of a sequel yesterday’s post: Where’s the sea ice? 3 reasons the Arctic freeze is unseasonably late and why it matters.

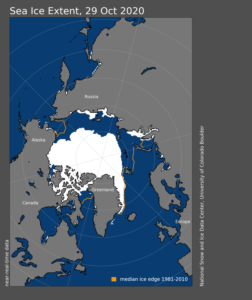
What a difference a day can make! Looks like it’s starting to crust over:

Figure 0. Daily sea ice extent map, October 29, 2020. (NSIDC)

Two key takeaways:

  1. Maximum Holocene sea ice extent occurred within the past 500-1,000 years at every location.
  2. The current sea ice extent is higher at all of the locations than over 50% to 85% of the Holocene.

While this doesn’t tell us what the sea ice extent was in million km2, it does tell us that the modern sea ice extent is larger than it was over most of the Holocene Epoch. It also tells us that the areas of currently seasonal sea ice extent have been seasonal or reduced over most of the past 5,000 years and ice-free or nearly ice-free over the prior 3,000 years or so. Here’s is the Kinnard graph plotted at the same horizontal scale as the Stein cross section:

Permian–Triassic mass extinction pulses driven by major marine carbon cycle perturbations

by Jurikova, H. et al., Oct 19, 2020 in NatureGeoscience


Abstract

The Permian/Triassic boundary approximately 251.9 million years ago marked the most severe environmental crisis identified in the geological record, which dictated the onwards course for the evolution of life. Magmatism from Siberian Traps is thought to have played an important role, but the causational trigger and its feedbacks are yet to be fully understood. Here we present a new boron-isotope-derived seawater pH record from fossil brachiopod shells deposited on the Tethys shelf that demonstrates a substantial decline in seawater pH coeval with the onset of the mass extinction in the latest Permian. Combined with carbon isotope data, our results are integrated in a geochemical model that resolves the carbon cycle dynamics as well as the ocean redox conditions and nitrogen isotope turnover. We find that the initial ocean acidification was intimately linked to a large pulse of carbon degassing from the Siberian sill intrusions. We unravel the consequences of the greenhouse effect on the marine environment, and show how elevated sea surface temperatures, export production and nutrient input driven by increased rates of chemical weathering gave rise to widespread deoxygenation and sporadic sulfide poisoning of the oceans in the earliest Triassic. Our findings enable us to assemble a consistent biogeochemical reconstruction of the mechanisms that resulted in the largest Phanerozoic mass extinction.

A Geological Perspective of Polar Bears

by D. Middelton, Oct 11, 2020 in WUWT


Estimates have ranged from 70,000 to 5,000,000 years ago. The oldest confirmed polar bear fossil dates to 110,000 to 130,000 years ago… Meaning that polar bears survived the Eemian interglacial stage.

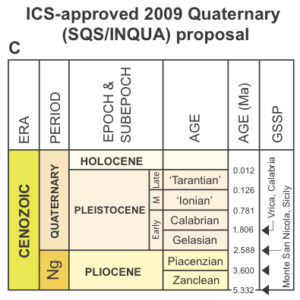
The peak warmth of the Eemian interglacial stage marks the boundary between the Late Pleistocene Tarantian Age and the Middle Pleistocene Ionian Age.

A New Mass Extinction Event Has Been Discovered, And It Triggered The Rise of Dinosaurs

by M. Benton, Sep 25, 2020 in ScienceAlert


Huge volcanic eruptions 233 million years ago pumped carbon dioxide, methane, and water vapour into the atmosphere. This series of violent explosions, on what we now know as the west coast of Canada, led to massive global warming.

Our new research has revealed that this was a planet-changing mass extinction event that killed off many of the dominant tetrapods and heralded the dawn of the dinosaurs.

The best known mass extinction happened at the end of the Cretaceous period, 66 million years ago. This is when dinosaurs, pterosaurs, marine reptiles and ammonites all died out.

This event was caused primarily by the impact of a giant asteroid that blacked out the light of the sun and caused darkness and freezing, followed by other massive perturbations of the oceans and atmosphere.

Geologists and palaeontologists agree on a roster of five such events, of which the end-Cretaceous mass extinction was the last. So our new discovery of a previously unknown mass extinction might seem unexpected.

And yet this event, termed the Carnian Pluvial Episode (CPE), seems to have killed as many species as the giant asteroid did. Ecosystems on land and sea were profoundly changed, as the planet got warmer and drier.

On land, this triggered profound changes in plants and herbivores. In turn, with the decline of the dominant plant-eating tetrapods, such as rhynchosaurs and dicynodonts, the dinosaurs were given their chance.

Scientists Find Peak 1940s Warmth, Post-1950s Cooling In The Same Western US Region Where Hockey Sticks Emerged

by K. Richard, Sep 24, 2020 in NoTricksZone


A new 1735-2015 temperature reconstruction (Heeter et al., 2020) using Western US tree ring proxies shows peak 1940s warmth and post-1950s cooling. This is the same region Dr. Michael Mann used tree ring data to construct his famous hockey stick graph.

A new Scandinavian temperature reconstruction (Seftigen et al., 2020) that’s “skillfull in characterizing past temperature changes over the past one to two millennia” finds there

Undersea earthquakes shake up climate science

by C. Rotter, Sep 20, 2020 in WUWT


Despite climate change being most obvious to people as unseasonably warm winter days or melting glaciers, as much as 95 percent of the extra heat trapped on Earth by greenhouse gases is held in the world’s oceans. For that reason, monitoring the temperature of ocean waters has been a priority for climate scientists, and now Caltech researchers have discovered that seismic rumblings on the seafloor can provide them with another tool for doing that.

In a new paper publishing in Science, the researchers show how they are able to make use of existing seismic monitoring equipment, as well as historic seismic data, to determine how much the temperature of the earth’s oceans has changed and continues changing, even at depths that are normally out of the reach of conventional tools.

They do this by listening for the sounds from the many earthquakes that regularly occur under the ocean, says Jörn Callies, assistant professor of environmental science and engineering at Caltech and study co-author. Callies says these earthquake sounds are powerful and travel long distances through the ocean without significantly weakening, which makes them easy to monitor.

Wenbo Wu, postdoctoral scholar in geophysics and lead author of the paper, explains that when an earthquake happens under the ocean, most of its energy travels through the earth, but a portion of that energy is transmitted into the water as sound. These sound waves propagate outward from the quake’s epicenter just like seismic waves that travel through the ground, but the sound waves move at a much slower speed. As a result, ground waves will arrive at a seismic monitoring station first, followed by the sound waves, which will appear as a secondary signal of the same event. The effect is roughly similar to how you can often see the flash from lightning seconds before you hear its thunder.


IMAGE: AN ARTIST’S RENDERING OF UNDERSEA EARTHQUAKE WAVES. view more CREDIT: CALTECH

SANGAY VOLCANO ERUPTS TO 40,000 FT (12.2 KM)

by Cap Allon, Sep 21, 2020 in Electroverse


Ecuador’s active Sangay Volcano exploded in dramatic fashion over the weekend, firing volcanic ash high into the atmosphere — the explosion was a number of times stronger than those previously observed during the volcano’s recent uptick.

The ‘high-level’ eruption occurred at 04:20 local time on Sunday, September 20 and generated a dense, dark ash plume, but the ‘biggie’ was sandwiched between numerous other powerful blasts that occurred throughout the weekend:

More crucially though, particulates ejected to around 32,800 ft (10 km) –and into the stratosphere– can have a direct cooling effect across the planet.

Volcanic eruptions are one of the key forcings driving Earth into its next bout of global cooling. Their worldwide uptick (along with a seismic uptick) is tied to low solar activity, coronal holes, a waning magnetosphere, and the influx of Cosmic Rays penetrating silica-rich magma.

A 500-million-year survey of Earth’s climate reveals dire warning for humanity

by P. Voosen, May 22, 2019 in AAAS/Science


When it opens next month, the revamped fossil hall of the Smithsonian Institution’s National Museum of Natural History in Washington, D.C., will be more than a vault of dinosaur bones. It will show how Earth’s climate has shifted over the eons, driving radical changes in life, and how, in the modern age, one form of life—humans—is, in turn, transforming the climate.

To tell that story, Scott Wing and Brian Huber, a paleobotanist and paleontologist, respectively, at the museum, wanted to chart swings in Earth’s average surface temperature over the past 500 million years or so. The two researchers also thought a temperature curve could counter climate contrarians’ claim that global warming is no concern because Earth was much hotter millions of years ago. Wing and Huber wanted to show the reality of ancient temperature extremes—and how rapid shifts between them have led to mass extinctions. Abrupt climate changes, Wing says, “have catastrophic side effects that are really hard to adapt to.”

But actually making the chart was unexpectedly challenging—and triggered a major effortto reconstruct the record. Although far from complete, the research is already showing that some ancient climates were even more extreme than was thought.

Que nous apprend l’Optimum Climatique Romain?

by A. Préat, 4 septembre 2020 in ScienceClimatEnergie


1/ Introduction

SCE a plusieurs fois rapporté que la période actuelle de réchauffement n’est pas exceptionnelle, qu’elle fait partie de cycles décennaux à pluriséculaires de refroidissement et réchauffement qui ont lieu dans des fourchettes de température fort modestes, de l’ordre de 0,15°C par 10 ans. SCE a aussi montré que le CO2 tant incriminé dans ces changements, et surtout l’actuel, n’avait pas de raison d’être, ce gaz venant après l’augmentation de température. Le ‘bouton CO2 ‘ à même d’expliquer ou de ‘justifier’ le battage médiatique quasi-quotidien est donc à ‘la remorque’ de la température et, l’hypothèse de l’effet de serre reste avant tout une hypothèse (exemple ici).

Volcanic ash may have a bigger impact on the climate than we thought

by University of Colorado at Boulder, Sep 11, 2020 in ScienceDaily


“They saw some large particles floating around in the atmosphere a month after the eruption,” Zhu said. “It looked like ash.”

She explained that scientists have long known that volcanic eruptions can take a toll on the planet’s climate. These events blast huge amounts of sulfur-rich particles high into Earth’s atmosphere where they can block sunlight from reaching the ground.

Researchers haven’t thought, however, that ash could play much of a role in that cooling effect. These chunks of rocky debris, scientists reasoned, are so heavy that most of them likely fall out of volcanic clouds not long after an eruption.

Zhu’s team wanted to find out why that wasn’t the case with Kelut. Drawing on aircraft and satellite observations of the unfolding disaster, the group discovered that the volcano’s plume seemed to be rife with small and lightweight particles of ash — tiny particles that were likely capable of floating in the air for long periods of time, much like dandelion fluff.

Journal Reference:

  1. Yunqian Zhu, Owen B. Toon, Eric J. Jensen, Charles G. Bardeen, Michael J. Mills, Margaret A. Tolbert, Pengfei Yu, Sarah Woods. Persisting volcanic ash particles impact stratospheric SO2 lifetime and aerosol optical properties. Nature Communications, 2020; 11 (1) DOI: 10.1038/s41467-020-18352-5

“NEW LITTLE ICE AGE INSTEAD OF GLOBAL WARMING?” BY DR THEODOR LANDSCHEIDT

by Cap Allon, September 7, 2020 in Electroverse


Among the long list or scientific papers suggesting that a solar-driven spell of global cooling is on the cards, Dr Theodor Landscheidt’s ‘New Little ICE Age Instead of Global Warming?‘ probably has the claim of priority.

Published in 2003, just a year before his death, Landscheidt’s research is standing the test of time, and is still largely on course to be proved correct.

The paper’s abstract begins:

‘Analysis of the sun’s varying activity in the last two millennia indicates that contrary to the IPCC’s speculation about man-made global warming as high as 5.8C within the next hundred years, a long period of cool climate with its coldest phase around 2030 is to be expected.’

Crucially, in the growing list of research concluding that a solar-driven multidecadal spell of global cooling is on the cards (research from multiple studies of quite different characteristics), the year 2030 ALWAYS features prominently. Unlike the IPCC, which tosses its thermageddon doomsday date back and forth like a hot potato, researchers who track the multimillennial plays of the cosmos (namely those of the Sun) routinely land on the year 2030 as being the date of ‘climate deterioration’: this in itself should serve as compelling evidence.

Dr Landscheidt continues:

‘It is shown that minima in the 80 to 90-year Gleissberg cycle of solar activity, coinciding with periods of cool climate on Earth, are consistently linked to an 83-year cycle in the change of the rotary force driving the sun’s oscillatory motion … As the future course of this cycle and its amplitudes can be computed, it can be seen that the Gleissberg minimum around 2030 and another one around 2200 will be of the Maunder minimum type accompanied by severe cooling on Earth. This forecast should prove skillful as other long-range forecasts of climate phenomena, based on cycles in the sun’s orbital motion, have turned out correct as for instance the prediction of the last three El Niño years before the respective event.’

Dr Landscheidt concludes his introduction with the IPCC’s position on global warming, and he points to a growing list of publications showing a solar-climate connection:

Vague de froid en Amérique du Sud : le front froid austral franchit l’équateur !

by Géoclimat, 26 août 2020


L’Amérique du Sud a connu une vague de froid particulièrement remarquable par son intensité et son étendue géographique du 19 au 23 août 2020, c’est-à-dire durant la seconde partie de l’hiver météorologique austral qui s’achève à la fin de ce mois.

Cet épisode froid est intervenu alors que l’hémisphère sud enregistre un déficit thermique significatif depuis le début du mois d’août et une tendance à la baisse de la température moyenne sur les 5 derniers mois. Dans ce contexte climatique, plusieurs coups de froid se sont produits dans l’hémisphère sud depuis le début de l’hiver, notamment en Australie au début du mois d’août avec un record absolu de froid enregistré par l’État insulaire de Tasmanie le 7 août (-14,2°C à Liawenee) et des chutes de neige abondantes au centre de l’île le 5 août (les plus importantes à Launceston depuis la tempête de neige du 31 juillet 1921), en Afrique australe à plusieurs reprises durant l’hiver, dans le sud-ouest de l’océan Indien en août, dans plusieurs archipels de l’Océanie (en Polynésie française en juin et début juillet, en Nouvelle-Calédonie à la mi-juillet), ou encore dans le sud de l’Argentine dès la fin du mois de juin avec -20,0°C le 27 juin à l’aéroport de Perito Moreno en Patagonie qui enregistre à cette occasion sa plus basse température pour un mois d’août depuis 1961 (précédent record : -18,2°C le 21 juin 2002), puis durant la première quinzaine de juillet avec des températures anormalement basses en Patagonie qui enregistre son 4e mois de juillet le plus froid depuis 1961 et d’abondantes chutes de neige à basse altitude en Patagonie et sur les reliefs andins (en particulier dans la province de Mendoza où il n’avait pas autant neigé depuis plus de 15 ans et jamais autant sur une période de 10 jours).

Une vague de froid plus intense et de plus grande ampleur a touché l’Amérique du Sud à partir du 19 août 2020, avec des températures particulièrement basses en Argentine les 20 et 21 août : plusieurs stations dans le centre et le nord du pays ont enregistré un record mensuel de froid, comme Villa Reynolds (-13,1°C le 20), Santa Rosa de Conlara (-12,0°C le 20), Río Cuarto (-5,0°C le 20), Córdoba (-6,5°C le 21), Presidencia Roque Sáenz Peña (-6,1°C le 21) et Corrientes (-1,7°C le 21).

New Northern North Atlantic Study Finds The Coldest Period With The Most Sea Ice Of The Last ~85 Years…Is Today

by K. Richard, August 24, 2020 in NoTricksZone


Ecological conditions for 3 temperature- and sea ice-sensitive species show the sub-Arctic North Atlantic has been cooling and gaining ice since 1940.

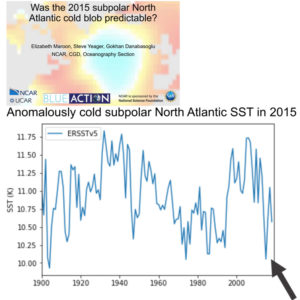
In recent months, several scientific publications have documented a dramatic cooling trend in the subpolar North Atlantic, with temperatures plummeting 2°C since 2008 (Bryden et al., 2020) or -0.78°C per decade since 2004 (Fröb et al., 2019). Maroon et al. (2020) even point out 2015 was the coldest of the last 100 years.


Fossil leaves show high atmospheric carbon spurred ancient ‘global greening’ Charles Rotter / 3 days ago August 20, 2020

by EARTH INSTITUTE AT COLUMBIA UNIVERSITY, August 20, 2020 in WUWT


Scientists studying leaves from a 23-million-year-old forest have for the first time linked high levels of atmospheric carbon dioxide with increased plant growth, and the hot climate off the time. The finding adds to the understanding of how rising CO2 heats the earth, and how the dynamics of plant life could shift within decades, when CO2 levels may closely mirror those of the distant past.

Scientists retrieved the leaves from a unique onetime New Zealand lake bed that holds the remains of plants, algae, spiders, beetle, flies, fungi and other living things from a warm period known as the early Miocene. Scientists have long postulated that CO2 was high then, and some plants could harvest it more efficiently for photosynthesis. This is the first study to show that those things actually happened in tandem. The findings were published this week in the journal Climate of the Past.

“The amazing thing is that these leaves are basically mummified, so we have their original chemical compositions, and can see all their fine features under a microscope,” said lead author Tammo Reichgelt, an adjunct scientist at Columbia University’s Lamont-Doherty Earth Observatory and assistant professor of geosciences at the University of Connecticut. “Evidence has been building that CO2 was high then, but there have been paradoxes.”


IMAGE: A 23-MILLION-YEAR-OLD LEAF PRESERVED IN A ONETIME NEW ZEALAND LAKE BED, KEY TO PAST ATMOSPHERIC CONDITIONS. ONE CAN SEE VEINS, GLANDS ALONG THE TEETH, AND HOLES GNAWED BY INSECTS, WITH… view more CREDIT: JENNIFER BANNISTER/UNIVERSITY OF OTAGO

VICTORY FOR SCIENCE! German Research Foundation Regrets Censorship, Reinstate’s Critic’s Statement

by P. Gosselin, August 7, 2020 in NoTricksZone


After widespread criticism, the German Research Foundation (DFG) has decided to reverse its July 30th decision to take down a dissident climate science statement from prominent German satirist Dieter Nuhr (background here).

The DFG has put Nuhr’s statement back online again after realizing it had blundered when it caved in to activists and had not acted in the interest of science (pdf here).

The German Research Foundation is back, again in favor of diversity of scientific opinion! Image: Galileo fails to change Catholic Church doctrine.

Satellite survey shows California’s sinking coastal hotspots

by Arizona State University, August 2, 2020 in WUWT


A majority of the world population lives on low lying lands near the sea, some of which are predicted to submerge by the end of the 21st century due to rising sea levels.

The most relevant quantity for assessing the impacts of sea-level change on these communities is the relative sea-level rise – the elevation change between the Earth’s surface height and sea surface height. For an observer standing on the coastland, relative sea-level rise is the net change in the sea level, which also includes the rise and fall of the land beneath observer’s feet.

Now, using precise measurements from state-of-the-art satellite-based interferometric synthetic aperture radar (InSAR) that can detect the land surface rise and fall with millimeter accuracy, an Arizona State University research team has, for the first time, tracked the entire California coast’s vertical land motion.

They’ve identified local hotspots of the sinking coast, in the cities of San Diego, Los Angeles, Santa Cruz and San Francisco, with a combined population of 4 to 8 million people exposed to rapid land subsidence, who will be at a higher flooding risk during the decades ahead of projected sea-level rise.

“We have ushered in a new era of coastal mapping at greater than 1,000 fold higher detail and resolution than ever before,” said Manoochehr Shirzaei, who is the principal investigator of the NASA-funded project. “The unprecedented detail and submillimeter accuracy resolved in our vertical land motion dataset can transform the understanding of natural and anthropogenic changes in relative sea-level and associated hazards.”

The results were published in this week’s issue of Science Advances (DOI link here).