by Anthony Watts, July 30, 2019 in WUWT
A review of state-of-the-art climate data tells a different story than what NOAA tells the public.
While media outlets scream “hottest ever” for the world in June and July (it’s summer) and opportunistic climate crusaders use those headlines to push the idea of a “climate crisis” the reality is for USA is that so far most of 2019 has been below normal, temperature-wise.
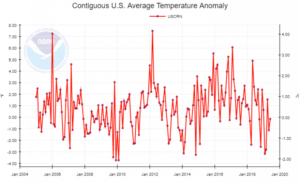
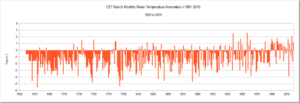
Little known data from the state of the art U.S. Climate Reference Network (which never seems to make it into NOAA’s monthly “state of the climate” reports) show that for the past nine months, six of them were below normal, shown in bold below.
201810 -0.18°F 201811 -2.56°F 201812 2.39°F 201901 0.63°F 201902 -3.15°F 201903 -2.81°F 201904 1.55°F 201905 -1.13°F 201906 -0.14°F Above: Table 1, U.S. average temperature anomaly from October 2018 to June 2019. Full data file here
…