Archives par mot-clé : Fun?/Discussion

Malfeasant Omissions? German Flagship ARD Broadcasting One-Sided, Drama-Making Sea Level Reporting

by Dr. S. Lüning, August 9, 2019 in NoTricksZone


What follows is another example of the tricks the mainstream media use to produce fake drama and urgency concerning sea level rise and climate change – namely omissions – and how geologist Sebastian Lüning held their feet to the fire.

Dr. Sebastian Lüning wrote a complaint to German ARD public broadcasting concerning its December 2, 2018, one-sided reporting of the Indian island of Ghoramara and the sea level rise it is allegedly experiencing. The €6.9 billion euro publicly funded, 22,612-employee ARD is the German equivalent to the UK’s BBC.

What follows is the exchange between Lüning and the ARD editorial staff:

Anthropocene: “it will be the rocks that have the final say” about this fake word.

by David Middleton, August 7, 2019 in WUWT


The fake geologic epoch known as the “Anthropocene” just won’t die… It’s like a zombie from a bad science fiction movie.

Despite being populated with activists like Naomi Oreskes, it has taken the AWG ten years to vote on what their conclusion will be and to start looking for evidence to support their conclusion… And the vote wasn’t unanimous.

Here’s where the Anthropocene dies…


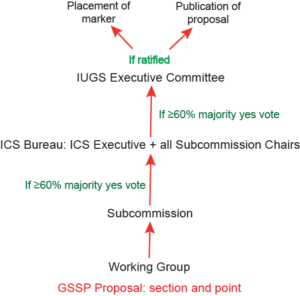
Figure 4 from Finney & Edwards.  “Workflow for approval and ratification of a Global Standard Stratotype Section and Point (GSSP) proposal. Extensive discussion and evaluation occurs at the level of the working group, subcommission, and International Commission on Stratigraphy (ICS) Bureau. If approved at these successive levels, a proposal is forwarded to the International Union of Geological Sciences (IUGS) for ratification. This process is also followed for other ICS decisions on standardization, such as approval of names of formal units, of revisions to the units, and to revision or replacement of GSSPs.”

Fake news: an open letter to the Editor of the Washington Post

by Christopher Monckton of Brenchley, August 5, 2019 in WUWT


 Yet again, the hard-Left Washington Post has libeled Dr Willie Soon, whom many of us know to be one of the most dedicated scientists in single-minded pursuit of the objective truth about global warming. If you agree with the following Letter to the Editor, please write your own letter and send it in to the Washpot.

Sir,

The Post’s inaccurate and malicious personal attack on Dr. Willie Soon

….

Why You Shouldn’t Draw Trend Lines on Graphs

by Kip Hansen,  August 6, 2019 in WUWT


What we call a graph is more properly referred to as “a graphical representation of data.”  One very common form of graphical representation is “a diagram showing the relation between variable quantities, typically of two variables, each measured along one of a pair of axes at right angles.”

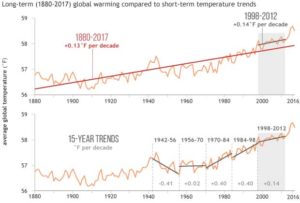
Here at WUWT we see a lot of graphs —  all sorts of graphs of a lot of different data sets.  Here is a commonly shown graph offered by NOAA taken from a piece at Climate.gov called “Did global warming stop in 1998?” by Rebecca Lindsey published on September 4, 2018.


I am not interested in the details of this graphic representation — the whole thing qualifies as “silliness”.  The vertical scale is in degrees Fahrenheit and the entire range change over 140 years shown is on the scale 2.5 °F or about a degree and a half C.   The interesting thing about the graph is the effort of drawing of “trend lines” on top of the data to convey to the reader something about the data that the author of the graphic representation wants to communicate.  This “something” is an opinion — it is always an opinion — it is not part of the data.

The data is the data.  Turning the data into a graphical representation (all right, I’ll just use “graph” from here on….), making the data into a graph has already  injected opinion and personal judgement into the data through choice of start and end dates, vertical and horizontal scales and, in this case, the shading of a 15-year period at one end.  Sometimes the decisions as to vertical and horizontal scale are made by software — not rational humans —  causing even further confusion and sometimes gross misrepresentation.

Anyone who cannot see the data clearly in the top graph without the aid of the red trend lineshould find another field of study (or see their optometrist).  The bottom graph has been turned into a propaganda statement by the addition of five opinions in the form of mini-trend lines.

La localisation temporelle et géographique des stations de mesure de la température pose des problèmes

by Carl-Stéphane Huot, 30 juillet 2019 in ScienceClimatEnergie


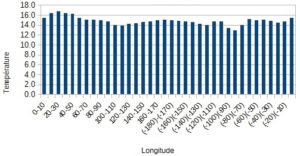
La notion de réchauffement climatique préoccupe bon nombre de gens depuis des années. Cependant, ce réchauffement apparent pourrait être influencé par le déplacement de stations météorologiques vers les zones plus chaudes de la planète, soit plus  près de l’équateur, soit à des altitudes plus basses.  La modélisation du climat est aussi influencée par l’existence de régions sans, ou avec très peu, de stations météorologiques.

Graphique 1 : Température moyenne selon la classe de longitude.

Conclusion

La variation extrêmement élevée du nombre de stations météorologiques servant au calcul de la température mondiale a contribué depuis le début des années 1950 à une partie au moins de l’élévation de  température. La dérive de celles-ci d’une place à l’autre fausse la précision des données que l’on peut en tirer, et contribue à augmenter l’inquiétude de la population. L’emplacement et le nombre de stations à installer posent un certain nombre de problèmes autant scientifiques que techniques et  politiques, et rend, avec d’autres éléments, (par exemple l’effet d’urbanisation, non abordé ici) extrêmement difficile de parler de réchauffement climatique.

Relation entre l’ activité sismique dans les océans et le réchauffement global (août 2019)

c/o Luc Trullemans,  août 2019 in PublicMétéo


Introduction

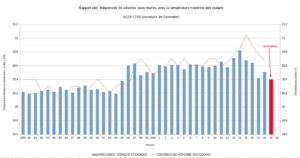
Une forte relation à été observée ces dernières années entre de l’activité sismique dans les océans et le récent réchauffement climatique  (CSARGW ,Correlation of Seismic Activity and Recent Global Warming) .

Cette corrélation entre de l’activité sismique océanique et le réchauffement climatique avait déjà été remarquée de 1979 à 2016 (CSARGW16) et vient d’être confirmée jusqu’en 2018.

Dans cette note, on démontre que  l’activité sismique dans les océans ( =>tremblements de terre de magnitude 4-6) provoque des flux géothermiques sous-marins et ont une relation importante avec les fluctuations de la température globale des océans (SST) et de la température globale de l’air (GT).

Ceci avance une nouvelle l’hypothèse selon laquelle l’activité sismique océanique pourrait être  un des paramètres  les plus importants dans la variation de la température globale.


Greenland Ice sheet Meltdown Scare–Except It’s Not True

by P.  Homewood,  August 1, 2019 in NotaLotofPeopleKnowThat


The same heat dome that roasted Europe and broke national temperature records in five countries last week has shifted to Greenland, where it is causing one of the biggest melt events ever observed on the fragile ice sheet.

By some measures, the ice melt is more extreme than during a benchmark record event in July 2012, according to scientists analyzing the latest data. During that event, about 98 percent of the ice sheet experienced some surface melting, speeding up the process of shedding ice into the ocean.

The fate of Greenland’s ice sheet is of critical importance to every coastal resident in the world, since Greenland is already the biggest contributor to modern-day sea level rise. The pace and extent of Greenland ice melt will help determine how high sea levels climb and how quickly….

The Danish Meteorological Institute tweeted that more than half the ice sheet experienced some degree of melting on Tuesday, according to a computer model simulation, which made it the “highest this year by some distance.”

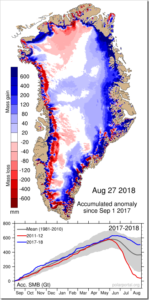
And there is no mention of the fact that the ice sheet grew substantially last year, and also the year before:

The simple fact is that the Greenland ice sheet melts every summer, particularly when the sun shines. That’s what it does. And it grows back again in winter as the snow falls. Indeed, if it did not melt, it would carry on growing year after year.

Inevitably there are some days when the weather is warmer and sunnier than normal, and others when it is colder. To pick an odd day or two is ridiculous and dishonest scaremongering.

See also here and here

Hockey Stick Groundhog Day

by P. Homewood, August, 1, 2019 in NotaLotofPeopleKnowThat


Some ancient history

Fifteen to twenty years ago, Michael Mann and colleagues wrote a few papers claiming that current warming was unprecedented over the last 600 to 2000 years.  Other climate scientists described Mann’s work variously as crap, pathetic, sloppy, and crap.  These papers caught the interest of Stephen McIntyre and this led to the creation of his Climate Audit blog and the publication of paperspointing out the flaws in these hockey stick reconstructions. In particular, Mcintyre and his co-author Ross McKitrick showed that the method used by Mann and colleagues shifted the data in such a way that any data sets that showed an upward trend in the 20th century would receive a stronger weighting in the final reconstruction.  With this method, generation of a hockey-stick shape in the temperature reconstruction was virtually guaranteed, which M&M demonstrated by feeding in random numbers to the method.

Net Zero Natural Gas Plant — The Game Changer

by James Conca, July 31, 2019 in Forbes


An actual game changing technology is being demonstrated as we sit in our air-conditioned abodes reading this. And it is being demonstrated by North Carolina–based Net Power at a new plant in La Porte, Texas.

The process involves burning fossil fuel with oxygen instead of air to generate electricity without emitting any carbon dioxide (CO2). Not using air also avoids generating NOx, the main atmospheric and health contaminant emitted from gas plants.

Former Award-Winning NOAA scientist Dr. Rex Fleming declares his climate dissent

by Marc Morano, July 30, 2019 in Climate Depot,


Former NOAA Award-Winning Atmospheric Scientist Dr. Rex Fleming joins many former UN IPCC and U.S. government scientists publicly dissenting on man-made climate change. Fleming declares that “CO2 has no impact on climate change.”

“Past climates have been warm and cold and warm and cold with no changes in carbon dioxide. How can that be a cause when there’s no correlation.”

Fleming 8:10 on AMS, AGU, AAAS: “all 3 of those organizations will not support a “denier”..I could not get published in any of those organizations..as a denier..I had to go to Europe to publish a paper..it was peer-reviewed in Europe, it got thru, & it has been very successful”
Quote Tweet

Fleming’s work here: The Rise and Fall of the Carbon Dioxide Theory of Climate Change (2019)


New Record Temperature–But How Much Of It Is Due To UHI?

by P. Homewood, July 30, 2019 in NotaLotofPeopleKnowThat


Cambridge University Botanic Garden measured 38.7C (101.7F) on Thursday beating the previous UK record of 38.5C (101.3F), set in Kent in 2003.

A Met Office official was sent to check the equipment before verifying the new record on Monday.

Staff working at the garden on Thursday tweeted: “No wonder we all felt as if we’d melted.”

Daily temperatures have been measured by the weather station at the site in the south of the city since 1904.

Cambridge University Botanic Garden director, Beverley Glover, said: “We are really pleased that our careful recording of the weather, something that we’ve been doing every day for over 100 years at the Botanic Garden, has been useful to the Met Office in defining the scale of this latest heatwave.

“Our long history of weather recording is very important to researchers analysing climate change.

“However, we can’t help but feel dismay at the high temperature recorded and the implication that our local climate is getting hotter, with inevitable consequences for the plants and animals around us.”

https://www.bbc.co.uk/news/uk-49157898


In fact, Cambridge’s new record tells us very little about “climate change”, but an awful lot about the Urban Heat Island Effect, or UHI.

The pause in global warming shows CO2 may be *more* powerful! Say hello to Hyperwarming Wierdness.

by JoNova, July 24, 2019


It’s all so obvious. If researchers start with models that don’t work, they can find anything they look for — even abject nonsense which is the complete opposite of what the models predicted.

Holy Simulation! Let’s take this reasoning and run with it  — in the unlikely event we actually get relentless rising temperatures, that will imply that the climate sensitivity of CO2 is lower. Can’t see that press release coming…

Nature has sunk so low these days it’s competing with The Onion.

The big problem bugging believers was that global warming paused, which no model predicted, and which remains unexplained still, despite moving goal posts, searching in data that doesn’t exist, and using error bars 17 times larger than the signal. The immutable problem is that energy shalt not be created nor destroyed, so The Pause still matters even years after it stopped pausing. The empty space still shows the models don’t understand the climate — CO2 was supposed to be heating the world, all day, everyday. Quadrillions of Joules have to go somewhere, they can’t just vanish, but models don’t know where they went. If we can’t explain the pause, we can’t explain the cause, and the models can’t predict anything.

In studies like these, the broken model is not a bug, it’s a mandatory requirement — if these models actually worked, it wouldn’t be as easy to produce any and every conclusion that an unskeptical scientist could hope to “be surprised” by.

The true value of this study, if any, is in 100 years time when some psychology PhD student will be able to complete an extra paragraph on the 6th dimensional flexibility of human rationalization and confirmation bias.

Busted climate models can literally prove anything. The more busted they are, the better.

More sensitive climates are more variable climates

University of Exeter

A decade without any global warming is more likely to happen if the climate is more sensitive to carbon dioxide emissions, new research has revealed.

12 New Papers Provide Robust Evidence The Earth Was Warmer During Medieval Times

by K. Richard, July 29, 2019 in NoTricksZone


Claims that modern temperatures are globally warmer than they were during Medieval times (~800 to 1250 A.D.) have been contradicted by a flurry of new (2019) scientific papers.

Southern Ocean/SE Pacific (SSTs)

The Medieval Warm Period (1100 years BP) was 1.5°C warmer than today (14°C vs. 12.5°C) in the SE Pacific or Southern Ocean.


See also here

What the Climate Change Models Actually Say

by R. Murphy, July 20, 2019 in FoundationEconomicEducation


An Earth scientist’s recent article making the rounds on social media highlights a terrifying conversation he had with “a very senior member” of the IPCC, which is the UN’s body devoted to studying climate science. The upshot of their conversation was that millions of people will die from climate change, a conclusion that leads the author to lament that humans have created a consumption-driven civilization that is “hell-bent on destroying itself.”

As with most such alarmist rhetoric, there is little to document these sweeping claims—even if we restrict ourselves to “official” sources of information, including the IPCC reports themselves. The historical record does not justify panic, but instead should lead us to expect continued progress for humanity, so long as the normal operation of voluntary market interactions continues without significant political interference to sabotage it.

Here is the opening hook from James Dyke’s article, in which he grabs the reader with an apocalyptic conversation:

Why Climate Change Wasn’t Behind Paris’s Record-High Temperature

by Chris Martz, July 27, 019 in ClimateChangeDispatch


It’s summer, temperatures are hot - sometimes record hot - and as usual, climate alarmism reaches record highs as climate activists have a field day with fearmongering rather than with facts and data.

Every week, various weather events end up getting caught in the spokes of the wheel of climate; it’s an endless cycle. Rinse, wash, repeat.

This time, it’s the [second] European heatwave this summer.

A Bit of Historical Perspective

While countries like the Netherlands, Germany, and Belgium have recorded their hottest temperatures on record this week, Paris’s record high of 108.7°F (42.6°C) on Thursday, July 25, made international headlines and consequently sparked climate insanity.¹

The graph below (Figure 1) shows the maximum temperature in Paris, France for each year since 1900.² As indicated by the red trendline, there has been a noticeable increase in the annual maximum temperature in Paris over the long run, however, the trend is not alarming.

Paris’s previous hottest temperature record stood for nearly 72 years.³

On July 28, 1947, the city reached 104.7°F (40.4°C).³ Paris’s high of 108.7°F (42.6°C) on Thursday broke the old record by 4°F (2.2°C), an incredible feat by any stretch of the imagination.

To break an all-time temperature record by 4°F in summer, let alone tie it, is extremely difficult to do, even with global warming.

Climate: about which temperature are we talking about?

by S. Furfari and H. Masson, July 26, 2019 in ScienceClimateEnergie


Is it the increase of temperature during the period 1980-2000 that has triggered the strong interest for the climate change issue? But actually, about which temperatures are we talking, and how reliable are the corresponding data?

1/ Measurement errors

Temperatures have been recorded with thermometers for a maximum of about 250 years, and by electronic sensors or satellites, since a few decades. For older data, one relies on “proxies” (tree rings, stomata, or other geological evidence requiring time and amplitude calibration, historical chronicles, almanacs, etc.). Each method has some experimental error, 0.1°C for a thermometer, much more for proxies. Switching from one method to another (for example from thermometer to electronic sensor or from electronic sensor to satellite data) requires some calibration and adjustment of the data, not always perfectly documented in the records. Also, as shown further in this paper, the length of the measurement window is of paramount importance for drawing conclusions on a possible trend observed in climate data. Some compromise is required between the accuracy of the data and their representativity.

2/ Time averaging errors

If one considers only “reliable” measurements made using thermometers, one needs to define daily, weekly, monthly, annually averaged temperatures. But before using electronic sensors, allowing quite continuous recording of the data, these measurements were made punctually, by hand, a few times a day. The daily averaging algorithm used changes from country to country and over time, in a way not perfectly documented in the data; which induces some errors (Limburg, 2014) . Also, the temperature follows seasonal cycles, linked to the solar activity and the local exposition to it (angle of incidence of the solar radiations) which means that when averaging monthly data, one compares temperatures (from the beginning and the end of the month) corresponding to different points on the seasonal cycle. Finally, as any experimental gardener knows, the cycles of the Moon have also some detectable effect on the temperature (a 14 days cycle is apparent in local temperature data, corresponding to the harmonic 2 of the Moon month, Frank, 2010); there are circa 13 moon cycle of 28 days in one solar year of 365 days, but the solar year is divided in 12 months, which induces some biases and fake trends (Masson, 2018).

3/ Spatial averaging

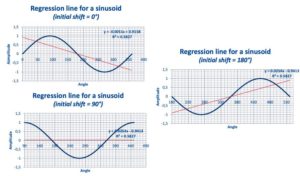
Figs. 12, 13 and 14 : Linear regression line over a single period of a sinusoid.


Conclusions


  1. IPCC projections result from mathematical models which need to be calibrated by making use of data from the past. The accuracy of the calibration data is of paramount importance, as the climate system is highly non-linear, and this is also the case for the (Navier-Stokes) equations and (Runge-Kutta integration) algorithms used in the IPCC computer models. Consequently, the system and also the way IPCC represent it, are highly sensitive to tiny changes in the value of parameters or initial conditions (the calibration data in the present case), that must be known with high accuracy. This is not the case, putting serious doubt on whatever conclusion that could be drawn from model projections.

  2. Most of the mainstream climate related data used by IPCC are indeed generated from meteo data collected at land meteo stations. This has two consequences:(i) The spatial coverage of the data is highly questionable, as the temperature over the oceans, representing 70% of the Earth surface, is mostly neglected or “guestimated” by interpolation;(ii) The number and location of theses land meteo stations has considerably changed over time, inducing biases and fake trends.

  3. The key indicator used by IPCC is the global temperature anomaly, obtained by spatially averaging, as well as possible, local anomalies. Local anomalies are the comparison of present local temperature to the averaged local temperature calculated over a previous fixed reference period of 30 years, changing each 30 years (1930-1960, 1960-1990, etc.). The concept of local anomaly is highly questionable, due to the presence of poly-cyclic components in the temperature data, inducing considerable biases and false trends when the “measurement window” is shorter than at least 6 times the longest period detectable in the data; which is unfortunately the case with temperature data

  4. Linear trend lines applied to (poly-)cyclic data of period similar to the length of the time window considered, open the door to any kind of fake conclusions, if not manipulations aimed to push one political agenda or another.

  5. Consequently, it is highly recommended to abandon the concept of global temperature anomaly and to focus on unbiased local meteo data to detect an eventual change in the local climate, which is a physically meaningful concept, and which is after all what is really of importance for local people, agriculture, industry, services, business, health and welfare in general.

CO2 Is So Powerful It Can Cause Global Warming To Pause For Decades

by Joanna Nova, July 24, 2019 in ClimateChangeDispatch


It’s all so obvious. If researchers start with models that don’t work, they can find anything they look for — even abject nonsense which is the complete opposite of what the models predicted.

Holy Simulation! Let’s take this reasoning and run with it  — in the unlikely event, we actually get relentless rising temperatures, that will imply that the climate sensitivity of CO2 is lower. Can’t see that press release coming…

Nature has sunk so low these days it’s competing with The Onion.

The big problem bugging believers was that global warming paused, which no model predicted, and which remains unexplained still, despite moving goalposts, searching in data that doesn’t exist, and using error bars 17 times larger than the signal.

The immutable problem is that energy shalt not be created nor destroyed, so The Pause still matters even years after it stopped pausing.

The empty space still shows the models don’t understand the climate — CO2 was supposed to be heating the world, all day, every day.

Quadrillions of Joules have to go somewhere, they can’t just vanish, but models don’t know where they went. If we can’t explain the pause, we can’t explain the cause, and the models can’t predict anything.

In studies like these, the broken model is not a bug, it’s a mandatory requirement — if these models actually worked, it wouldn’t be as easy to produce any and every conclusion that an unskeptical scientist could hope to “be surprised” by.

The true value of this study, if any, is in 100 years time when some psychology Ph.D. student will be able to complete an extra paragraph on the 6th-dimensional flexibility of human rationalization and confirmation bias.

Busted climate models can literally prove anything. The more busted they are, the better.

Developing nations latest decade of energy & emissions growth torpedoes alarmist global emissions control scam

by Larry Hamlin, July 23, 2019 in WUWT


The UN has been pursuing global emissions policy for decades that are intended to provide for the establishment of global government schemes allowing it to control world emissions.

No fewer than 24 United Nations Climate Change Conferences have been held at various global locations since 1995 under its Conference of the Parties (COP) legal framework.

COP 21 which occurred in November and December 2015 in Paris resulted in the creation of the Paris Agreement that supposedly established global agreement to reduce greenhouse gas emissions and limit future global temperatures that the UN based upon projections from climate models that grossly exaggerate the impact of greenhouse gases on world temperatures.

The UN IPCC acknowledged in its AR3 climate report in 2001 that it is not possible to develop computer models that are capable of predicting future global climate and yet the Paris Agreement based its emissions targets intended for the future using these flawed computer models.

Three additional UN climate conferences have occurred since the Paris Agreement with the last conference being in 2018 in Poland. No success has been achieved in these three conferences in devising specific commitments for emissions reductions targets for the world’s developing nations.

Additionally the U.S. under President Trump wisely withdrew from the Paris Agreement in June of 2017.

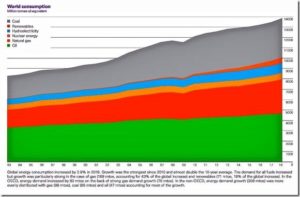
Global energy and emissions detailed information for 2018 is now available which includes data encompassing the latest decade of 2008 to 2018. The world energy consumption data from the report is summarized in the graph below.

This latest decade energy and emissions data clearly demonstrates that the developing nations completely dominate global energy and emissions. This includes both present levels as well as future growth. These results also show that the developed nations play a minority role in these measures both presently and in the future.

The results for the last decade show that global energy use grew by 18.5% during the last decade with 98.5% of that energy growth accounted for by the developing nations.

Thirty years of unique data reveal what’s really killing coral reefs

by P. Homewood, July 24, 201 in NotatLotofPeopleKnowThat


Coral reefs are considered one of the most threatened ecosystems on the planet and are dying at alarming rates around the world. Scientists attribute coral bleaching and ultimately massive coral death to a number of environmental stressors, in particular, warming water temperatures due to climate change.

A study published in the international journal Marine Biology, reveals what’s really killing coral reefs. With 30 years of unique data from Looe Key Reef in the lower Florida Keys, researchers from Florida Atlantic University’s Harbor Branch Oceanographic Institute and collaborators have discovered that the problem of coral bleaching is not just due to a warming planet, but also a planet that is simultaneously being enriched with reactive nitrogen from multiple sources.

Improperly treated sewage, fertilizers and top soil are elevating nitrogen levels, which are causing phosphorus starvation in the corals, reducing their temperature threshold for “bleaching.” These coral reefs were dying off long before they were impacted by rising water temperatures. This study represents the longest record of reactive nutrients and algae concentrations for coral reefs anywhere in the world.

“Our results provide compelling evidence that nitrogen loading from the Florida Keys and greater Everglades ecosystem caused by humans, rather than warming temperatures, is the primary driver of coral reef degradation at Looe Key Sanctuary Preservation Area during our long-term study,” said Brian Lapointe, Ph.D., senior author and a research professor at FAU’s Harbor Branch.


https://phys.org/news/2019-07-years-unique-reveal-coral-reefs.html


There is the usual armwaving about climate change, but no evidence is presented as to why a small increase in CO2 levels should have the slightest effect on water temperatures or coral development, when the climate has been much warmer for most of the period since the end of the ice age.

As is usually the case with environmental degradation and species decline, it is the obvious factors which are responsible.

1980s Science: Ice Cores Show CO2 Naturally Rose 200 ppm (65 ppm/100 Years) During The Early Holocene

by K. Richard, July 22, 2019 in NoTricksZone


A few decades ago it was “consensus” science that CO2 levels had reached 400 ppm (and even up to 500 ppm) during the Early Holocene, with rising amplitudes of greater than 200 ppm and rates of 65 ppm in less than a century. Then the “consensus” opinion changed.

In 1982 it was still quite acceptable for Dr. Flohn, a climate scientist, to acknowledge that changes in CO2 concentration changes are significantly determined by temperature “rather independent of” fossil fuel emissions, but also that Holocene CO2 concentrations reached 350 to 400 ppm between 8,000 to 6,000 years ago (Flohn, 1982).

Why the discrepancy between “consensus” CO2 and historically recorded CO2?

Polish physicist Dr. Zbigniew Jaworowski (1997) was a fierce critic of the means by which ice core data have been collected to assign CO2 concentration values to past epochs.

His criticisms center around the post-1985 tendencies for fellow scientists to openly employ selection bias in making pre-determined decisions about what measurements are “right” and which ones are “wrong” – effectively rendering their results meaningless.

He cites Pearlman et al. (1986), for example. These authors collected 74 Antarctic ice core CO2 samples. Of those, 32 (43%) were rejected because they had values that were too high or too low to match with the agreed-upon pre-determination.

In what other branch of science is it acceptable to discard measured data we don’t agree with?


New York Heatwaves Like This Week’s Are The Norm

by P. Homewood, July 22, 2019 in NotaLotofPeopleKnowThat


Extremely hot weather has started to hit most of the United States, with temperatures set to peak over the weekend, meteorologists say.

The heatwave could affect about 200 million people in major cities like New York, Washington and Boston in the East Coast, and the Midwest region too.

In some places, temperatures could be close to or exceed 100F (38C). Parts of Canada are also being hit.

Experts link more frequent heatwaves in recent years to climate change.

The world experienced its hottest June on record this year, with an average temperature worldwide of 61.6F (16.4C), according to new data.

Earlier this month, the US state of Alaska, part of which lies inside the Arctic Circle, registered record high temperatures.

https://www.bbc.co.uk/news/world-us-canada-49049378


As I revealed last week, the Alaska claim was fake.

But what about this latest heatwave? Is it anything unusual?

Well not in New York, that’s for sure.

The temperature in Central Park never even got near 100F, peaking at 95F yesterday.


http://climod2.nrcc.cornell.edu/

LE PEER-REVIEW, IRREPROCHABLE ?

by Jo Moreau, 17 juillet 2019 in Belgotopia


Quel est le principe de fonctionnement du « peer review », ou révision par les pairs 

Nous avons déjà pu apprécier à quel point la publication d’un article dans une revue scientifique pratiquant le « peer review » constitue pour certains le sommet, et même la condition sine qua non pour se voir accorder l’autorisation d’émettre un avis sur un sujet donné (dans notre cas : le réchauffement, pardon, les changements climatiques).

L’exemple le plus récent est illustré par la position d’un réseau social bien connu qui émet un avis à la limite calomnieux à l’égard d’un physicien par ailleurs professeur d’université, qui a fait l’objet de mon article précédent : https://belgotopia.com/2019/07/15/menaces-ouvertes-sur-les-ecrits-giecosceptiques/

Comment cela fonctionne-t-il ? Le scientifique (ou le groupe de scientifiques) soumet son étude à l’éditeur de la revue qu‘il aura choisie (ou à plusieurs d‘entre eux). Il s’agit souvent du premier filtre, l’éditeur jugeant si l’étude est ou non conforme à la ligne éditoriale de la revue. Le physicien Edwin BERRY vient encore d’en faire l’expérience. Son étude « Le CO2 d’origine humaine a peu d’effet sur le CO2 présent dans l’atmosphère » a été refusée par l’American Journal of Climate Change sous le seul et unique motif que « La conclusion de cet article est complètement opposée au consensus de la communauté universitaire ». Evidemment, le fait que Ed BERRY soit un GIECosceptique affirmé n’aura pas favorisé sa démarche …

2019 Climate “Ship Of Fools” Runs Into 3-Meter Thick Ice… Baffin Inlets Mid Summer Ice Extent No Trend in 50 Years

by P. Gosselin, July 19, 2019 in NoTricksZone


Our German skeptic friend Snowfan here keeps us up to date on the latest ODEN “Ship of Fools” attempt to travel across an Arctic that is supposed to be ice-free by now.

The incentive to cross the Arctic passages in the summer is huge. Doing so would mean at least a week of fame with the media blaring out your name along with grossly hyped headlines of an Arctic ice meltdown due to global warming. One of these years, a ship might get lucky and manage to get through the Northwest Passage.

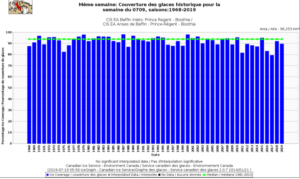
Also defying the models is the extent of ice cover for July 9 at the Baffin inlets Regent – Boothia. Over the last 50 years, there’s been little trend change:


Source: Canadian Ice Service

La croissance du CO2 dans l’atmosphère est-elle exclusivement anthropique? (3/3)

by J.C. Maurin, 19 juillet 2019 in ScienceClimatEnergie


Effet Bombe et Modèles du GIEC

Les prévisions du climat sont générées par des modèles informatiques. Leurs concepteurs pensent pouvoir décrire l’état moyen de l’atmosphère en 2100, en prenant comme principale donnée d’entrée, le taux futur de CO2 qui constituerait donc le ‘bouton de commande’ du climat.

Il y a deux étages de modélisation : on commence par prévoir le taux de CO2 en 2100 avec des modèles sélectionnés par le GIEC (ces modèles « IRF » du GIEC sont l’objet de l’article).
Cette prévision constitue ensuite l’entrée du second étage, à savoir les modèles types « échanges radiatifs » ou « effet de serre » qui ne sont pas traités ici (mais on peut consulter ceci).
Le présent article ( qui est la suite de deux autres ici et ici) compare la réponse impulsionnelle théorique de ces modèles « IRF » avec la réponse impulsionnelle observée du 14CO2(effet Bombe).

NO EXPERIMENTAL EVIDENCE FOR THE SIGNIFICANT ANTHROPOGENIC CLIMATE CHANGE

by J. Kauppinen and P. Malmi, July 13, 2019 in Physics.gen-ph


Abstract. In this paper we wil lprove that GCM-models used inI IPCC report AR5 fail to calculate the influences of the low cloud cover changes on the global temperature. That is why those models give a very small natural temperature change leaving a very large change for the contribution of the green house gases in the observed temperature. This is the reason why IPCC has to use a very large sensitivity to compensate a too small natural component. Further they have to leave out the strong negative feedback due to the clouds in order to magnify the sensitivity. In addition, this paper proves that the changes in the low cloud cover fraction practically control the global temperature.

1. Introduction

The climate sensitivity has an extremely large uncertainty in the scientific lit- erature. The smallest values estimated are very close to zero while the highest ones are even 9 degrees Celsius for a doubling of CO2. The majority of the papers are using theoretical general circulation models (GCM) for the estimation. These models give very big sensitivities with a very large uncertainty range. Typically sensitivity values are between 2–5 degrees. IPCC uses these papers to estimate the global temperature anomalies and the climate sensitivity. However, there are a lot of papers, where sensitivities lower than one degree are estimated without using GCM. The basic problem is still a missing experimental evidence of the cli- mate sensitivity. One of the authors (JK) worked as an expert reviewer of IPCC AR5 report. One of his comments concerned the missing experimental evidence for the very large sensitivity presented in the report [1]. As a response to the com- ment IPCC claims that an observational evidence exists for example in Technical Summary of the report. In this paper we will study the case carefully.

2. Low cloud cover controls practically the global temperature