Archives par mot-clé : Temperature

New paper finds strong evidence the Sun has controlled climate over the past 11,000 years, not CO2

by ‘hockeschtick‘, November 27, 2014


A paper published today in Journal of Atmospheric and Solar-Terrestrial Physics finds a “strong and stable correlation” between the millennial variations in sunspots and the temperature in Antarctica over the past 11,000 years. In stark contrast, the authors find no strong or stable correlation between temperature and CO2 over that same period.

We have thus shown
  • Strong correlation between solar activity and climate over the past 11,000 years of the Holocene
  • Strong lack of correlation between CO2 and climate over the past 11,000 years of the Holocene
  • Solar activity explains all 6 well-known warming periods that have occurred during the Holocene, including the current warm period
  • The 20th century peak in sunspot activity is associated with a 40 year lag in the peak global temperature

Reconstructing a Temperature History Using Complete and Partial Data

by Mark Fife, April 19, 2018 in WUWT


In today’s post I am going to go over how I went about creating a reconstruction of the history of temperature from the GHCN data sets using a variable number of stations reporting each year for the years of 1900 to 2011. Before I go into the details of that reconstruction, let me cover how I went about discarding some alternative methods.

I decided to create a test case for reconstruction methods by picking five random, complete station records. I then deleted a portion of one of those records. I mimicked actual record conditions within the GHCN data so my testing would be realistic. In different trials I deleted all but the last 20 years, all but the first 20 years or some number of years in the middle. I tried normalizing each station to its own average and averaging the anomalies. I tried averaging the four complete stations, then normalizing the fourth station by its average distance from the main average. In all cases when I plotted the reconstruction against the true average the errors were quite large.normalizing the fourth station by its average distance from the main average. In all cases when I plotted the reconstruction against the true average the errors were quite large.

A conversation with Dr. Willie Soon – on polar bears, the sun, and Earth’s climate

by Dr. Willie Soon, April 14, 2018 in WUWT

Dr. Willie Soon is an independent solar physicist at the Harvard-Smithsonian Center for Astrophysics who has been studying the Sun and its influence on the Earth’s climate for more than a quarter of a century. A short while ago, he had a conversation with Mr. Grégoire Canlorbe, an independent journalist who is also vice president of the French Parti National-Libéral (“National-Liberal Party,” conservative, nationalist, and free-marketist). Here Dr. Soon speaks for himself. 

Canlorbe: You say polar bears are far less endangered by global warming than by environmentalists dreading ice melt. Could you expand?

(…)

Science Fact: Per NOAA, “Global Warming” Pause For U.S. Now Exceeds 22 Years (Wrong?)

by C3 Headlines, April 2018


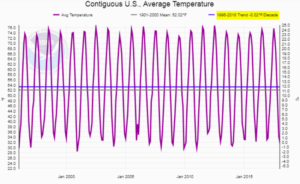
The chart above was produced by NOAA at their ‘Climate at a Glance’ web page. In the upper right corner of the chart, NOAA shows its calculated per decade trend of -0.02°F for a period that spans 1996-2018.

After posting this chart and an accompanying article, it just seemed that something was likely wrong with the trend calculation produced by NOAA’s web site.

Climatic Cycles Globally…Spitzbergen Weather Records Show It Was Just As Warm 70 Years Ago!

by P. Gosselin, April 8, 2018 in NoTricksZone


On Spitzbergen it was as warm 70 years ago as it is today

By Dr. Sebastian Lüning and Prof. Fritz Vahrenholt
(German text translated by P Gosselin)

Newspapers like to write about heat and melt records in the Arctic, which supposedly had never happened before. That really sparks fear among the citizens. However an examination of the facts regularly brings amazing things to light, for example weather records from a German station on Spitzbergen during World War 2 for the period of 1944-1945.

In the journal International Journal of Climatology Rajmund Przybylak and his colleagues evaluated the data. Summary: Back then it was similarly warm as it is today

Hot Days Near Tokyo Today Not More Than 70 Years Ago…No Trend Since 1926!

by P. Gosselin, April 7, 2018 in NoTricksZone


If you haven’t already picked up a copy of the The Politically Incorrect Guide to Climate Change, please do get your hands on one.

According to its author Marc Morano, people have been snatching them up and a third printing has started. The book even made the Amazon top 100 best selling books for awhile.

It also ranked first in a number of categories. In his book, NoTricksZone gets mentioned 4 times and even took up one full page at one spot!

So now on to today’s post…

UAH finds a warming error in satellite data, lowers “tropical hotspot” temperature trend, contradicts IPCC models

by Anthony Watts, April 6, 2018 in WUWT


Weather Satellite Wanders Through Time, Space, Causing Stray Warming to Contaminate Data

In the late 1990s, the NOAA-14 weather satellite went wandering through time and space, apparently changing the record of Earth’s climate as it went.

Designed for an orbit synchronized with the sun, NOAA-14’s orbit from pole to pole was supposed to cross the equator at 1:30 p.m. on the sunlit side of the globe and at 1:30 a.m. on the dark side, 14 times each day. One of the instruments it carried was a microwave sounding unit (MSU), which looked down at the world and collected data on temperatures in Earth’s atmosphere and how those temperatures changed through time.

The Pause Has Returned.

by P. Homewood, April 5, 2018 in NotaLotofPeopleKnowThat


Hadcrut now have numbers out for February, giving an anomaly of 0.523C, measured against the 1961-90 baseline, slightly down on January’s 0.556C.

This means that the last six months have been below 0.59C.

It is clear that temperatures are settling down at a similar level to the period between 2002 and 2007, following the record El Nino of 2015/16. Bear in mind as well that the degree of accuracy, according to the Hadley Centre, is about +/-0.1C. As such, it cannot be said that there has been any statistically measurable warming since 2001, or indeed previously.

It is possible temperatures may drop further in coming months, with weak La Nina conditions established, although these are predicted to disappear by the summer.

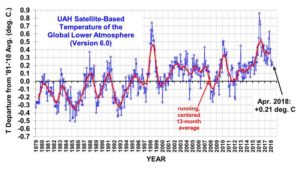
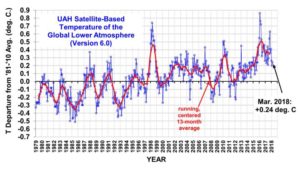
Global Temperature Report: March 2018

by Anthony Watts, April 4, 2018 in WUWT


March temperatures (preliminary)

Global composite temp.: +0.24 C (about 0.43 degrees Fahrenheit) above 30-year average for March.

Northern Hemisphere: +0.39 C (about 0.70 degrees Fahrenheit) above 30-year average for March.

Southern Hemisphere: +0.10 C (about 0.18 degrees Fahrenheit) above 30-year average for March.

Tropics: +0.06 C (about 0.11 degrees Fahrenheit) above 30-year average for March.

February temperatures (revised):

Global Composite: +0.20 C above 30-year average

Northern Hemisphere: +0.24 C above 30-year average

Southern Hemisphere: +0.15 C above 30-year average

Tropics: +0.03 C above 30-year average

(All temperature anomalies are based on a 30-year average (1981-2010) for the month reported.)


Antarctic Temperature Data Contradict Global Warming…”Much Warmer” 105 Years Ago!

by P. Gosselin, April 3 , 2018 in NoTricksZone


Despite all the alarmist claims of an Antarctic meltdown, it is well known that the trend for sea ice extent at the South Pole has been one of growing ice rather than shrinking ice over the past 4 decades.

Naturally many factors influence polar sea ice extent, such as weather patterns, winds, ocean currents and sea surface temperature cycles. One factor of course is also surface air temperature, which according to global warming theorists is rising globally (…)

Uh oh– analysis of GHCN climate stations shows there is no statistically significant warming – or cooling

by Mark Fife, April1, 2018 in WUWT


This is my eighth post in this series where I am examining long term temperature records for the period 1900 to 2011 contained in the Global Historical Climatology Network daily temperature records. I would encourage anyone to start at the first post and go forward. However, this post will serve as a standalone document. In this post I have taken my experience in exploring the history of Australia and applied it forward to cover North America and Europe.

The way to view this study is literally a statistic-based survey of the data. Meaning I have created a statistic to quantify, rank, and categorize the data. My statistic is very straight forward; it is simply the net change in temperature between the first and last 10 years of 1900 through 2011 for each station.

BBC Regrets Climate Error And Failure To Meet Usual Standards Of Reporting — Then Does It Again

by P. Homewood, March 2, 2018 in NotaLotofPeopleKnowThat


Everybody makes mistakes, and some of them matter. On the BBC’s News at Ten on the 18th January 2018 there were two of them, and the GWPF complained a few days later.

The first error was in describing the global temperature of 2017 as the “hottest year on record,” which it wasn’t.

The second mistake was that the BBC’s Environment Analyst Roger Harrabin said that, “2017 had no heating from El Nino,” which was also incorrect.

We pointed out that whilst 2017 was not designated a year in which there was an El Nino event (defined as a period with prolonged El Nino heating) there was in fact El Nino heating in the northern spring for 11 weeks, and we provided a graph to prove it. (Click on image to enlarge)(…)

Mystery solved : Rain means satellite and surface temps are different. Climate models didn’t predict this…

by JoNova, March 18, 2018


A funny thing happens when you line up satellite and surface temperatures over Australia. A lot of the time they are very close, but some years the surface records from the Australian Bureau of Meteorology (BOM) are cooler by a full half a degree than the UAH satellite readings. Before anyone yells “adjustments”, this appears to be a real difference of instruments, but solving this mystery turns up a rather major flaw in climate models (…)

46 New (2018) Non-Warming Graphs Affirm Nothing Climatically Unusual Is Happening

by K. Richard, March 22, 2018 in NoTricksZone


During 2017, there were 150 graphs from 122 scientific papers published in peer-reviewed journals indicating modern temperatures are not unprecedented, unusual, or hockey-stick-shaped — nor do they fall outside the range of natural variability.

We are less than 3 months into the new publication year.  Already 46 new graphs from 40+ scientific papers undermine claims that modern era warming — or, in some regions, modern cooling — is climatically unusual.

Where The Warmth Is

by Willis Eschenbach, March 24, 2018 in WUWT


I got to thinking about the “hiatus” in warming in the 21st Century, and I realized that the CERES satellite dataset covers the period since the year 2000. So I’ve graphed up a few views of the temperature changes over the period of the CERES record, which at present is May 2000 to February 2017. No great insights, just a good overview and some interesting findings.

How Not To Model The Historical Temperature

by Willis Eschenbach, March 24, 2018 in WUWT


Much has been made of the argument that natural forcings alone are not sufficient to explain the 20th Century temperature variations. Here’s the IPCC on the subject:

(…)

I’m sure you can see the problems with this. The computer model has been optimized to hindcast the past temperature changes using both natural and anthropogenic forcings … so of course, when you pull a random group of forcings out of the inputs, it will perform more poorly.

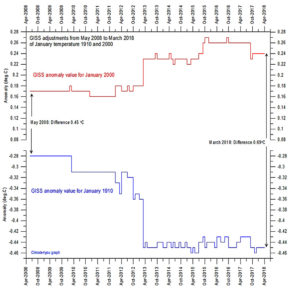
Since 2008, 0.24°C Of ‘Extra’ Warming Has Been Added To NASA’s 1910-2000 Global Temperatures

by K. Richard, March 19, 2018 in NoTricksZone


In the last 10 years, overseers of the NASA GISS global temperature data set have been busy utilizing cool-the-past-and-warm-the-present adjustment techniques to alter the slope of the overall warming trend.

For example, as the climate4you graph illustrates above, there was a +0.45°Cdifference between the 1910 temperature anomaly and the 2000 temperature anomaly as of May, 2008.

Today (March, 2018), NASA GISS has tendentiously adjusted up the difference between 1910 and 2000 to +0.69°C, a 53% increase.

Long Temperature Records and Sunspot Minima

by Willy Eschenbach, March 18, 2018 in WUWT


Well, folks were complaining that my graph of the CET compared to the centennial solar minima was just one location, England. So here are the five European temperature records which start before 1815. Now, if the theory of the solar/temperature connection is correct, the temperatures should start trending downward when the solar minima start, and they shouldn’t start warming back up until the sunspots get numerous again after the end of the minima. Here are the records so you can see if they agree with the theory.

(…) As you can see, there is no obvious sign that the solar minima have caused any change in the temperature. Some go up, some go down, some go nowhere.(…)

See also here Approaching ‘grand solar minimum’ could cause global cooling

QUI CONNAIT LA TEMPERATURE GLOBALE REELLE DE LA PLANETE ?

by Jo Moreau, 19 mars, 2018 in Belgotopia


La question est posée dans un excellent article de Pierre Gosselin paru en juin 2017 sur son site incontournable (1).

Personnellement, et je ne suis évidemment pas le seul, je n’accorde aucun crédit aux annonces tonitruantes d’ “année la plus chaude”, de “record de température” dont sont si friands nos médias, et je conserve un scepticisme identique pour la détermination de la température globale moyenne de la planète. En effet, pour qui s’intéresse à l’actualité climatique, les contradictions et manipulations dans les relevés de température terrestre sont monnaie courante, sous prétexte bien souvent d’ajustements et de mise à niveau, que ce soit pour les relevés actuels ou “l’actualisation” de données anciennes…
L’avenir est connu, il suffit de modifier le passé“.

(…)

Climate scientist admits embarrassment over future climate uncertainty

by J. Cartwright, March 16, 2018 in A. Watts WUWT


WUWT readers may recall this chart which clearly illustrates just how uncertain climate science really is.

t seems that some climate academics are a bit embarrassed that they haven’t been able to pin down climate sensitivity. From EU Horizon Magazine

Climate sensitivity – reducing the uncertainty of uncertainty

by Jon Cartwright

A study published in January 2018 claims to halve the uncertainty around how much our planet’s temperature will change in response to rising carbon dioxide (CO2) levels, potentially giving governments more confidence to prepare for the future.

New paper tries to disentangle global warming from natural ocean variations

by A. Watts, March 15, 2018 in WUWT


This paper deals with the central argument that skeptics bring up about claims of global warming: How do you separate the temperature signal from the base components like natural variation, human land-use influence, micro-site bias, measurement errors and biases, and other factors to get the “true” global warming signal?

The answer is that you can’t, at least not easily.

With the surface temperature record, it’s somewhat easier since  you can observe some of those elements directly and separate them (such as we’ve done in our surfacestations project for land-use microsite biases), but in the ocean, everything is homogenized by the ocean itself. All you can look for is patterns, and try to disentangle based on pattern recognition. That’s what they are trying to do here.

Disentangling Global Warming, Multidecadal Variability, and El Niño in Pacific Temperatures
Authors
Robert C. Wills, Tapio Schneider, John M. Wallace, David S. Battisti, Dennis L. Hartmann


(…)

NOAA Tamper With NY Temperatures Again

by P. Homewood, March 15, 2015 in NotaLotofPeopleKnowThat


According to the heavily adjusted NOAA data, last month was the fifth warmest February on record in the Central Lakes Division of NY State, with an average mean temperature of 31.4F.

Prior to 1981, the warmest was February 1954, which averaged 29.8F. In other words, NOAA claim that February 1954 was 1.6F colder than last month.

Which all looks very suspicious, because the opposite picture is shown at the high quality station of Ithaca Cornell University (…)

Ice-Free Arctic Fantasies Melting Away As Temperatures Plummet…Sea Ice Mass Grows Impressively

by P. Gosselin, March 14, 2018 in NoTricksZone


German skeptic and weather expert ‘Schneefan’ here writes how climate activist Mark C. Serreze recently announced this year’s sea ice extent was at the smallest all-time area. But since then Arctic temperatures have plummeted and sea ice area has grown to over 14 million square kilometers (…)