Greenland Is Way Cool

by Willis Eschenbach, January 8, 2019


As a result of a tweet by Steve McIntyre, I was made aware of an interesting dataset. This is a look by Vinther et al. at the last ~12,000 years of temperatures on the Greenland ice cap. The dataset is available here.

Figure 1 shows the full length of the data, along with the change in summer insolation at 75°N, the general location of the ice cores used to create the temperature dataset.

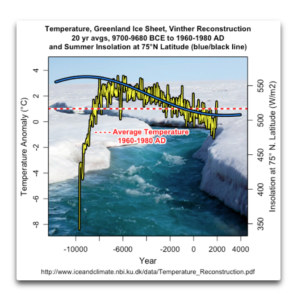
Figure 1. Temperature anomalies of the Greenland ice sheet (left scale, yellow/black line), and the summer insolation in watts per square metre at 75°N (right scale, blue/black line). The red horizontal dashed line shows the average ice sheet temperature 1960-1980.

I’ll only say a few things about each of the graphs in this post. Regarding Figure 1, the insolation swing shown above is about fifty watts per square metre. Over the period in question, the temperature dropped about two and a half degrees from the peak in about 5800 BCE. That would mean the change is on the order of 0.05°C for each watt per square metre change in insolation …

Is the forecasted El Niño for this year fading away? It sure looks that way.

by Anthony Watts, January 8, 2019 in WUWT


In late 2018, there were some predictions that there would be a significant El Niño event in 2019. There were strong hints of an El Niño event in both SST data and forecasts. In an April 6th 2018 essay, Bob Tisdale suggested  “Looks like one may be forming right now.”

But if we look at the animation provided by NOAA’s Climate prediction center, it sure looks like it has been fading:

Arctic Sea Ice Extent Higher Than 2006 Last Month

by P. Homewood, January 9, 2019 in NotaLotofPeopleKnowThat


Just last March, the Guardian was trying to panic us about record lows in Arctic sea ice during last winter.

Back in the real world, DMI confirm that average Arctic sea ice extent in December was higher last month than in 2006. In reality, there has been very little change at all since 2005.

http://ocean.dmi.dk/arctic/icethickness/txt/IceVol.txt


Algae thrive under Greenland sea ice

by Bigelow Laboratory for Ocean Sciences, January 8, 2019 in ScicneDaily


Microscopic marine plants flourish beneath the ice that covers the Greenland Sea, according to a new study. These phytoplankton create the energy that fuels ocean ecosystems, and the study found that half of this energy is produced under the sea ice in late winter and early spring, and the other half at the edge of the ice in spring.

U.S. Carbon Emissions Skyrocketed in 2018!

by David Middleton, January 8, 2009 in WUWT


Why did carbon emissions increase in 2018?

  • A booming economy.  GDP growth during the first 2 years of the Trump administration has been about 50% higher than that of Obama’s eight-year maladministration.

  • Our manufacturing sector is booming.

  • A cold winter.

  • A booming economy drove up trucking and air travel.

  • Electricity demand increased and most of the increasing was powered by natural gas because renewables couldn’t even keep up with no growth.

https://www.whitehouse.gov/articles/economy-firing-cylinders/

Another Climate Propaganda Story Promoting the Normal as Abnormal

by Dr Tim Ball, January 8, 2019 in WUWT


Other stories focus on a pattern or change in a pattern again with the idea that it is new or abnormal. Headlines like this one from 2012, “Why have there been more tornadoes than usual this year?” Often, they are suggestive such as this 2017 New York Times story. “The 2017 Hurricane Season Really Is More Intense Than Normal.” When you read the story, you find, as is usually the case, that the caveats at the end indicate it is not unusual. The problem is the headline already set the pattern in the public mind.

Natural Gas Power Plants Bringing $25 Billion to the Appalachian Basin

by Jackie Stewart, October 9, 2018 in EnergyInDepth


The Appalachian Basin is driving growth of record-shattering U.S. natural gas production, which in turn has helped spur more than $25 billion in natural gas electricity generation investment in the region. In fact, there are 29 new 475-megawatt (MW) or greater natural gas-fired power plants that are in various stages of permitting, under construction or have recently become operational in Ohio (10), Pennsylvania (16) and West Virginia (3), representing more than 26,000 MW of added electric capacity, more than 17,000 jobs during construction and incredible emissions reductions in the electricity sector.

Les COP se succèdent, le charbon résiste

by Connaissance des Energies, 18 décembre 2018


Trois jours après la clôture de la COP24, l’Agence internationale de l’énergie (AIE) a publié le 18 décembre son rapport annuel consacré au charbon. Elle y souligne le rôle central de cette énergie au niveau mondial et estime que sa consommation globale devrait rester stable dans les 5 prochaines années. Explications.

La consommation de charbon encore appelée à augmenter en Inde et en Asie du Sud-Est

Après deux années de baisse, la consommation mondiale de charbon a augmenté de près de 1% en 2017 et cette hausse devrait se poursuivre en 2018 selon les dernières estimations de l’AIE. Principalement consommé à des fins de production électrique(1), le charbon a encore compté pour 38% de la production mondiale d’électricité en 2017.

Dans son rapport Coal 2018, l’AIE estime que la consommation mondiale de charbon pourrait rester stable d’ici à 2023 : la baisse de la demande envisagée en Europe et en Amérique du Nord serait plus que compensée par une forte croissance de la consommation en Inde et en Asie du Sud-Est selon les prévisions de l’Agence.

Study reconstructing ocean warming finds ocean circulation changes may account for significant portion of sea level rise

by Anthony Watts, January 7, 2019 in WUWT


Study suggests that in the last 60 years up to half the observed warming and associated sea level rise in low- and mid- latitudes of the Atlantic Ocean is due to changes in ocean circulation.

Over the past century, increased greenhouse gas emissions have given rise to an excess of energy in the Earth system. More than 90% of this excess energy has been absorbed by the ocean, leading to increased ocean temperatures and associated sea level rise, while moderating surface warming.

The multi-disciplinary team of scientists have published estimates in PNAS, that global warming of the oceans of 436 x 1021 Joules has occurred from 1871 to present (roughly 1000 times annual worldwide human primary energy consumption) and that comparable warming happened over the periods 1920-1945 and 1990-2015.

U.S. Media Bans Scientific Dissent – Claim Wildfires, Floods, Droughts, Hurricanes Are Human-Controlled

by K. Richard, January 7, 2019 in NoTricksZone


NBC News’ Chuck Todd recently asserted that we humans can control the climate and the frequency or intensity of extreme weather events (hurricanes, floods, droughts) and disasters (wildfires) with our CO2 emissions. He has declared the science is “settled” on this point and therefore no “denier” is allowed on his Meet the Press program. But Todd and the members of his panel have recited claims that are contravened by observational evidence and scientific publications.

The Belgian electricity industry in chaos

by Prof. Samuel Furfari, January 7, 2019 in EuropeanScientist


Belgium’s electricity supply has become a serious problem. Without investment in new generation capacity, the security of electricity supply will deteriorate in the next few years. However, the country’s situation does not lend itself to optimism on this topic. Belgium is not a straightforward country. Its institutional structure can only be described as one of […] The post The Belgian electricity industry in chaos (https://www.europeanscientist.com/en/features/the-belgian-electricity-industry-in-chaos/) appeared first on European Scientist (https://www.europeanscientist.com/en)

4 oil price predictions for 2019

by Steve Austin, January 7, 2019 in Oil-Price.Net


Last year, we gave out five blazing predictions as we stepped into a brand new 2018. And, how did we fare? Well, the year isn’t new anymore but we did get 5 out of 5 of our predictions right! Self-congratulations are in order reaffirming why you read us. For 2019, really it’s more of the same, but with some caveats. Investors, listen. Readers, pay heed, we are about to deconstruct the next year. As audacious as it sounds, here are our 4 oil price predictions for 2019:

Forget El Nino, StormFest is about to Hit the West Coast

by Charles the moderator, January 6, 2019 in WUWT


Things often calm down after January 1 during El Nino years….but not this year…with the U.S. West Coast from central California to Washington State about to be pummeled by a series of storms.   Rain, snow, wind?  Plenty for everyone.

A view of the latest infrared satellite imagery shows an amazing line-up of one storm after another stretching way into the Pacific.  A traffic jam of storms.


Let’s examine our stormy future, using a series of sea level pressure forecasts from the UW WRF weather forecast models (solid lines are sea level pressure, shading in lower atmosphere temperature).


Kerala Floods “Likely Due To Climate Variability, Not AGW”–New Study

by P. Homewood, January 5, 2019 in NotaLotofPeopleKnowThat


Since there is no increase in mean and extreme precipitation in Kerala over the last six decades, the extreme event during August 2018 is likely to be driven by anomalous atmospheric conditions due to climate variability rather anthropogenic climate warming. The severity of the Kerala flood of 2018 and the damage caused might be affected by several factors including land use/ land cover change, antecedent hydrologic conditions, reservoir storage and operations, encroachment of flood plains, and other natural factors. The impacts of key drivers (anthropogenic and natural) on flood severity need to be established to improve our understanding of floods and associated damage.

http://www.geosocindia.org/index.php/jgsi/article/view/137443

Storage wars

by Charles the moderator, January 5, 2019 in WUWT


UC Santa Barbara researcher conducts first-ever global-scale evaluation of the role of soil minerals in carbon storage

University of California – Santa Barbara

One answer to our greenhouse gas challenges may be right under our feet: Soil scientists Oliver Chadwick of UC Santa Barbara and Marc Kramer of Washington State University have found that minerals in soil can hold on to a significant amount of carbon pulled from the atmosphere. It’s a mechanism that could potentially be exploited as the world tries to shift its carbon economy.

“We’ve known for quite a long time that the carbon stored on minerals is the carbon that sticks around for a long time,” said Chadwick, co-author of the paper, “Climate-driven thresholds in reactive mineral retention of soil carbon at the global scale,” published in the journal Nature Climate Change. How much carbon the soil can take and how much it can keep, he said, are dependent on factors including temperature and moisture.

“Terrifying Sea-Level Prediction Now Looks Far Less Likely”… But “marine ice-cliff instability” is “just common sense”

by David Middleton, January 5, 2019 in WUWT


Marine ice cliff instability (MICI) “has not been observed, not at such a scale,” “might simply be a product of running a computer model of ice physics at a too-low resolution,” ignores post glacial rebound, couldn’t occur before ” until 2250 or 2300″… Yet “the idea is cinematic,” “it’s just common sense that Antarctic glaciers will develop problematic ice cliffs” and something we should plan for…

“Our results support growing evidence that calving glaciers are particularly sensitive to climate change.”  Greenland’s climate is always changing… Always has and always will change… And the climate changes observed over the last few decades are not unprecedented. The Greenland ice sheet is no more disappearing this year than it was last year and it is physically impossible for the ice sheet to “collapse” into the ocean.

Figure 6. Jakobshavn Isbrae. (Wikipedia and Google Earth)

Consensus? 500+ Scientific Papers Published In 2018 Support A Skeptical Position On Climate Alarm

by K. Richard, January 3, 2019 in NoTricksZone


In 2018,  over 500 scientific papers were published that cast doubt on the position that anthropogenic CO2 emissions function as the climate’s fundamental control knob…or that otherwise serve to question the efficacy of climate models or the related “consensus” positions commonly endorsed by policymakers and mainstream media sources.

UK Climate Trends – 2018

by P. Homewood, January 4, 2019 in NotaLotofPeopleKnowThat


The Met Office has now published its data for 2018. We can expect plenty of claims about last year being the 7th warmest in the UK since records began (in 1910). Or that all of the ten warmest years have occurred this century.

The real significance of these latest numbers, however, is that they continue to confirm that UK temperatures stopped rising more than a decade ago, after a step up during the 1990s.


https://www.metoffice.gov.uk/climate/uk/summaries/actualmonthly…


Sea level oscillations in Japan and China since the start of the 20th century and consequences for coastal management – Part 1: Japan Author links open overlay panel

by Albert Parker, March 1, 2019 in Ocean&CoastalManagement


Highlights
• Japan has strong quasi-20 and quasi-60 years low frequencies sea level fluctuations.
• These periodicities translate in specific length requirements of tide gauge records.
• 1894/1906 to present, there is no sea level acceleration in the 5 long-term stations.
• Those not affected by crustal movement (4 of 5) do not even show a rising trend.
Proper consideration of the natural oscillations should inform coastal planning.

See also here

Global-scale evaluation of role of soil minerals in carbon storage

by U. of California – Santa Barbara, January 2, 2019 in ScienceDaily


“We’ve known for quite a long time that the carbon stored on minerals is the carbon that sticks around for a long time,” said Chadwick, co-author of the paper, “Climate-driven thresholds in reactive mineral retention of soil carbon at the global scale,” published in the journal Nature Climate Change. How much carbon the soil can take and how much it can keep, he said, are dependent on factors including temperature and moisture.

“When plants photosynthesize, they draw carbon out of the atmosphere, then they die and their organic matter is incorporated in the soil,” Chadwick explained. “Bacteria decompose that organic matter, releasing carbon that can either go right back into the atmosphere as carbon dioxide or it can get held on the surface of soil minerals.”

..

Heads up Newfoundland & Labrador: polar bear season has begun

by Susan Crockford, January 2, 2019 in PolarBearScience


There is now enough sea ice off southern Labrador and the northern tip of Newfoundland for Davis Strait polar bears to come ashore looking for food. Baby seals won’t be available for months yet. And since winter is the lean season for these bears, some may seek food sources onshore. The bears come down from the area of Hudson Strait and southern Baffin Island: as the sea ice expands south, so do the bears.


Can wind and solar replace fossil fuels?

by Richard Patton, January 1, 2019 in WUWT


Statements implying that wind and solar can provide 50% of the power to the grid are not difficult to find on the internet. For example, Andrew Cuomo announced that

“The Clean Energy Standard will require 50 percent of New York’s electricity to come from renewable energy sources like wind and solar by 2030…”

Considering that the wind is erratic, and the solar cells only put out full power 6 hours per day, it seems a remarkable statement. Can intermittent energy actually supply that much power?

For some answers, we turn to Germany, which has some of the highest electric bills in the world as well as a high proportion of its electric power produced by wind and solar (19%). Let’s take a look at German consumption and generation.


La géologie, une science plus que passionnante … et diverse