L’hydrogène, l’éternelle illusion

by M. Gay & S. Furfari, 8 janvier 2020 in Contrepoints


L’hydrogène (H2) est une terrible illusion comme énergie alternative aux combustibles fossiles. Les médias semblent fascinés par ce gaz perçu comme une panacée, mais entre la science et la perception publique ou politique, il y a un abîme.

Cette erreur commune persiste notamment parce que Jeremy Rifkin, un gourou dans le domaine de l’hydrogène, a présenté The Hydrogen Economy dans laquelle ce gaz remplacerait les combustibles fossiles pour la production d’électricité et les transports.

Bon orateur répétant son mantra depuis maintenant plus de 15 ans, Rifkin a réussi à convaincre de nombreux politiciens, en particulier dans l’Union européenne (UE), que la révolution de l’hydrogène était en marche. Mais l’effet magique « abracadabra » ne fonctionne pas dans la science et l’économie.

Climate models continue to project too much warming

by Dr. J. Lehr & J. Taylor, January 6, 2020 in CFACT


A recently published paper, titled “Evaluating the Performance of Past Climate Model Projections,” mistakenly claims climate models have been remarkably accurate predicting future temperatures. The paper is receiving substantial media attention, but we urge caution before blindly accepting the paper’s assertions.
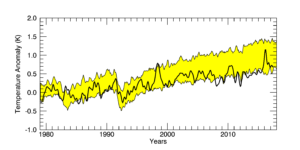
As an initial matter, the authors of the paper are climate modelers. Climate modelers have a vested self-interest in convincing people that climate modeling is accurate and worthy of continued government funding. The fact that the authors are climate modelers does not by itself invalidate the paper’s conclusions, but it should signal a need for careful scrutiny of the authors’ claims.

Co-author Gavin Schmidt has been one of the most prominent and outspoken persons asserting humans are creating a climate crisis and that immediate government action is needed to combat it. Again, Schmidt’s climate activism does not by itself invalidate the paper’s conclusions, but it should signal a need for careful scrutiny of the authors’ claims.

The paper examines predictions made by 17 climate models dating back to 1970. The paper asserts 14 of the 17 were remarkably accurate, with only three having predicted too much warming.

One of the paper’s key assertions is that global emissions have risen more slowly than commonly forecast, which the authors claim explains why temperatures are running colder than the models predicted. The authors compensate for this by adjusting the predicted model temperatures downward to reflect fewer-than-expected emissions. Yet fewer-than-expected greenhouse gas emissions undercut the climate crisis narrative.

The U.N. Intergovernmental Panel on Climate Change has already reduced its initial projection of 0.3 degrees Celsius of warming per decade to merely 0.2 degrees Celsius per decade. Keeping in mind that skeptics have typically predicted approximately 0.1 degree Celsius of warming per decade, the United Nations has conceded skeptics have been at least as close to the truth with their projections as the United Nations. Moreover, global temperatures are likely only rising at a pace of 0.13 degrees Celsius per decade, which is even closer to skeptic predictions.

Even after the authors adjusted the model predictions to reflect fewer-than-expected greenhouse gas emissions, there remains at least one very important problem, which immediately jumped out at us when carefully examining the paper’s findings: The paper’s assertion of remarkable model accuracy rests on a substantial temperature spike from 2015 through 2017. A strong, temporary El Niño caused the short-term spike in global temperatures from 2015 to 2017. The plotted temperature data in the paper, however, show that temperatures prior to the El Niño spike ran consistently colder than the models’ adjusted predicted temperatures. When the El Niño recedes, as they always do, temperatures will almost certainly resume running colder than the models predicted, even after adjusting for fewer-than-expected greenhouse gas emissions.

Another problem with the paper is that it utilizes controversial and dubiously adjusted temperature datasets rather than more reliable ones. The paper relies on temperature datasets that are not replicated in any real-world temperature measurements. Surface temperature measurements and measurements taken by highly precise satellite instruments show significantly less warming than the authors claim. The authors rely on temperature datasets that utilize controversial adjustments to claim more recent warming than what has actually been measured, which further undercuts their claim of remarkable model accuracy.

Contrary to what has been written in many breathless media reports, the most important takeaways from the paper are that greenhouse gas emissions are rising at a more modest pace than predicted, the modest pace of global temperature rise reflects the modest pace of rising emissions, and climate models have consistently predicted too much warming—even after accounting for fewer-than-expected greenhouse gas emissions. A temporary spike in global temperatures reflecting the recent El Niño does not save the models from their consistent inaccuracy.

The Fracking Decade

by Noah Rothman, January 2020, in Commentary


The malady afflicting the country was unmistakable, according to George W. Bush. “America is addicted to oil,” the president observed in his 2006 State of the Union address. This wasn’t just an observation. It was a call to arms. If the U.S. failed to wean itself off foreign oil, the consequences for the domestic economy and U.S. foreign policy would be grave. Doing so would require substantial investments in America’s ethanol industry as well as the development of oil deposits in pristine natural parks and off the nation’s shores.

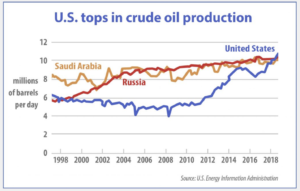
In 2008, the U.S. produced an average of just 5 million barrels of oil per day—the nadir of domestic energy production since the exploitation of fossil fuels began in the late 19th century. By 2009, the price of West Texas Intermediate crude was approaching $150 per barrel. The U.S., therefore, was obliged to spend over $1 billion per day on oil imports from foreign countries, few of which could be considered models of good governance. America’s thirst for oil propped up abusive governments in places such as the Democratic Republic of Congo, Venezuela, Pakistan, Saudi Arabia, Algeria, Mauritania, and Syria.


The Evidence Proves That CO2 is Not a Greenhouse Gas

by Tim Ball, September 13, 2018 in Technocracy.News


The Intergovernmental Panel on Climate Change (IPCC) claim of human-caused global warming (AGW) is built on the assumption that an increase in atmospheric CO2 causes an increase in global temperature. The IPCC claim is what science calls a theory, a hypothesis, or in simple English, a speculation.  Every theory is based on a set of assumptions. The standard scientific method is to challenge the theory by trying to disprove it. Karl Popper wrote about this approach in a 1963 article, Science as Falsification. Douglas Yates said,

“No scientific theory achieves public acceptance until it has been thoroughly discredited.”

Thomas Huxley made a similar observation.

“The improver of natural knowledge absolutely refuses to acknowledge authority, as such. For him, skepticism is the highest of duties; blind faith the one unpardonable sin.”

In other words, all scientists must be skeptics, which makes a mockery out of the charge that those who questioned AGW, were global warming skeptics. Michael Shermer provides a likely explanation for the effectiveness of the charge.

“Scientists are skeptics. It’s unfortunate that the word ‘skeptic’ has taken on other connotations in the culture involving nihilism and cynicism. Really, in its pure and original meaning, it’s just thoughtful inquiry.”

The scientific method was not used with the AGW theory. In fact, the exact opposite occurred, they tried to prove the theory. It is a treadmill guaranteed to make you misread, misrepresent, misuse and selectively choose data and evidence. This is precisely what the IPCC did and continued to do.

REE mineral-bearing rocks found in eastern Mojave Desert

by Geological Society of America, January 2, 2020 in ScienceDaily


Scientists from the U.S. Geological Survey (USGS) have mapped a rare earth element deposit of magmatic carbonatite located in the Mountain Pass region of the eastern Mojave Desert. The new report details the geophysical and geological setting of the deposit, including a map of the deposit’s subsurface extent, to help land-use managers evaluate sites for further exploration. The report was recently published in the Geological Society of America’s online journal, Geosphere.

Rare earth elements (REEs) are critical to emerging industrial technologies including strategic defense, science and medical, automotive and transportation, and civilian electronics. However, large economic REE sources are unique and uncommon worldwide. International concerns about increasing demand and global supply vulnerability have prompted many countries, including the U.S., to explore and assess domestic REE resources. Increased efforts to characterize geologic processes related to REE deposits in the U.S. have focused attention on the world-class Mountain Pass, California, deposit located approximately 60 miles southwest of Las Vegas, Nevada.

In their study, collaborators K.M. Denton and USGS colleagues use geophysical and geological techniques to image geologic structures related to REE mineral-bearing rocks at depth. Their work suggests REE minerals occur along a fault zone or geologic contact near the eastern edge of the Mescal Range. These findings could prove as a useful guide to future exploration efforts.

Early Holocene Temperature Oscillations Exceed Amplitude of Observed and Projected Warming in Svalbard Lakes

by Van der Bilt et al. , December 3, 2019 in GeophysResLetters


Abstract

Arctic climate is uniquely sensitive to ongoing warming. The feedbacks that drive this amplified response remain insufficiently quantified and misrepresented in model scenarios of future warming. Comparison with paleotemperature reconstructions from past warm intervals can help close this gap. The Early Holocene (11.7–8.2 ka BP) is an important target because Arctic temperatures were warmer than today. This study presents centennially resolved summer temperature reconstructions from three Svalbard lakes. We show that Early Holocene temperatures fluctuated between the coldest and warmest extremes of the past 12 ka, exceeding the range of instrumental observations and future projections. Peak warmth occurred ~10 ka BP, with temperatures 7 °C warmer than today due to high radiative forcing and intensified inflow of warm Atlantic waters. Between 9.5 and 8 ka BP, temperatures dropped in response to freshwater fluxes from melting ice. Facing similar mechanisms, our findings may provide insight into the near‐future response of Arctic climate.

It has been hotter, fires have burnt larger areas

by J. Marohasy, January 4, 2020 in WUWT


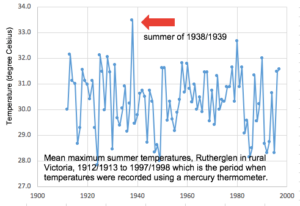
Last summer, and this summer, has been hot in Australia. But the summer of 1938-1939 was probably hotter — and back then more ferocious bushfires burnt larger areas. In rural Victoria, the summer of 1938-1939 was on average at least two degrees hotter than anything measured with equivalent equipment since, as shown in Figure 1.

Figure 1. Mean maximum summer (December, January February) temperatures as measured at Rutherglen in rural Victoria by The Australian Bureau of Meteorology for the period when mercury thermometers were used. Data unadjusted/not homogenised.

The summer of 1938-1939 was probably the hottest ever in recorded history for the states of New South Wales and Victoria. It is difficult to know for sure because the Bureau has since changed how temperatures are measured at many locations and has not provided any indication of how current electronic probes are recording relative to the earlier mercury thermometers.

Further, since 2011, the Bureau is not averaging measurements from these probes so the hottest recorded daily temperature is now a one-second spot reading from an electronic devise with a sheath of unknown thickness. In the United States similar equipment is used and the readings are averaged over five (5) minutes and then the measurement recorded.


See also: Australia Drought, The Indian Ocean Dipole & Sudden Stratospheric Warming

See also: Australia Bushfires – Is Blaming Greens a Conspiracy Theory?

See also : 24 People Charged For Setting Fires In New South Wales; Arrest Toll Hits 183

See also  : RISING LIKE A PHOENIX — AUSTRALIA’S FORESTS RENEW THEMSELVES

2004 Climate Apocalypse Prediction Bites the Dust

by David Middleton, January 3, 2020 in WUWT


Nolte: Department of Defense Predicted Climate Change Would Destroy Us by 2020

by JOHN NOLTE 3 Jan 2020

Back in 2004, the Department of Defense released a report assuring the world Climate Change would destroy all of us by the year 2020.

Well, welcome to the year 2020! And welcome to yet another fake doomsday prediction number 42 from our renowned climate experts!

Yep, our so-called “climate experts” are now 0-42 with their doomsday predictions, and this latest one is a doozy.

[…]


Australian Wildfire Latest

by P. Homewood, January 3, 2020 in NotaLotofPeopleKnowThat


According to the Telegraph, the current fires have affected 5.9m hectares, or 59,000 km2. While they claim this is three times the size of Wales, we need to remember that Australia is more than 30 times the size of the UK. 59,000 km2 represents 0.77% of Australia’s area, which in UK terms would be about 1800 km2, equivalent to three times the size of the New Forest.

.

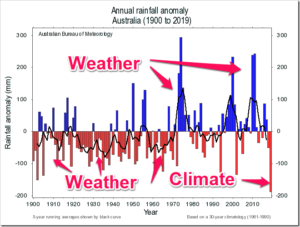
Now we can look at the rainfall data for Australia as a whole from BOM:

Certainly the area either side of the Queensland border shows the lowest rainfall on record, but most of the state has seen periods before with lower rainfall.

Also note that worst fires seem to be clustered towards the Victoria border, where rainfall deficiency has been less severe.

Finally it is worth revisiting the rainfall trend map. It shows that since 1900, most of the country has been getting wetter, with the exception of a small part of Queensland, and some coastal areas of Western Australia and southern Australia along with Tasmania:

Also: Let’s tell the burning truth about bushfires and the ALP-Greens coalition

Also : How Greens Made Australia’s Bushfires Worse

Also: Bushfire scientist David Packham warns of huge blaze threat, urges increase in fuel reduction burns

Also : Australia’s Epic Fires Caused By Bad Forestry And Arson, Not Climate Change

Also : Australian wildfires were caused by humans, not climate change

Also : Australian Bushfires Much Worse In 1974/5

Also : Climatologist: Blaming Aussie Bushfires On Climate Change Is ‘Alarmist Nonsense’

Also : Who Checks The Factcheckers?

Also : Fake News: “The idea that “greenies” … would oppose measures to prevent fires … is simply false.”

Also : Forgotten Fact: 1974/75 Australian Bush Fires Were More Than 9 Times Greater Than Those Of 2019/20!

Also : The Aussie Wildfires Are About Arsonists – Not Climate Change

Also : Climate change: Australia fires will be ‘normal’ in warmer world–Matt McGrath

Also : Australia fires: Aboriginal planners say the bush ‘needs to burn’

Also : Fight fire with fire: controlled burning could have protected Australia

Also : Regional Forest Manager: Politicians are Using Climate Change to Deflect Blame for Bushfires

Also Fight Fires With Facts – Not Fake Science

Des observations satellitaires qui ne confirment pas les modèles climatiques

by Jean N., 3 janvier 2020 in ScienceClimatEnergie


3. Conclusions

• Depuis plus de 40 ans que des mesures de température sont effectuées par satellite, la basse et la moyenne troposphère se réchauffent bel et bien. Mais sans aucune accélération visible, et ce à des vitesses de l’ordre de +0.13°C/décade et +0.09°C/décade. La vitesse de réchauffement décroit donc avec l’altitude.

• La zone correspondant à la tropopause (vers 10 km d’altitude) ne se réchauffe pas, contrairement à ce que les modèles informatiques prédisent (pour plus de détails voir les articles de J. Christy). Peut-on alors continuer à utiliser ces modèles pour prédire la température de certaines couches atmosphériques dans le futur? Notons ici que les observations satellitaires sont confirmées par des observations réalisées in situ avec des ballons-sondes.

• La basse stratosphère se refroidit actuellement à la vitesse d’environ –0.29°C par décade, et l’analyse de corrélation menée par Varotsos et Efstathiou nous suggère que le comportement de la stratosphère n’est pas simplement lié à celui de la troposphère, les choses étant plus complexes.

• Les modèles climatiques actuels, basés sur l’hypothèse d’un l’effet de serre radiatif causé essentiellement par du CO2 atmosphérique, sont donc à revoir. Le CO2 (naturel ou d’origine anthropique) pourrait donc n’avoir qu’un rôle mineur et imperceptible sur la température de la troposphère.

En conclusion générale, nous devons toujours garder à l’esprit que le système climatique est très complexe car il est composé de cinq sous-systèmes (atmosphère, cryosphère, hydrosphère, biosphère et lithosphère) et que ces 5 sous-systèmes interagissent les uns avec les autres dans l’espace et le temps avec des processus principalement non linéaires (Lovejoy et Varotsos, 2016) et se comportent de manière chaotique (voir ici). Par conséquent, la modification d’un seul paramètre dans l’un des sous-systèmes (par exemple, la température de la basse troposphère) ne permet pas de prévoir un changement climatique à long terme, car tous les autres paramètres de l’atmosphère mais aussi ceux des autres sous-systèmes (connus et mesurables, ou non) ne sont pas nécessairement connus et stables. En plus de tout cela plusieurs facteurs externes, imparfaitement connus, peuvent influencer chacun des sous-systèmes, comme les rayonnements cosmiques ou les variations du champ magnétique solaire.

An Exceptional Year? Hardly, Mr McCarthy

by P. Homewood, January 1, 2020 in NotaLotofPeopleKnowThat


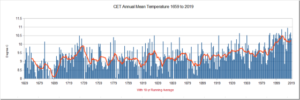
The year as a whole has been remarkably unremarkable, as far as temperatures are concerned, ranking only the 24th warmest on record since 1659, and not as warm as even 1733, 1779, 1834 and 1868:


https://www.metoffice.gov.uk/hadobs/hadcet/cet_info_mean.html

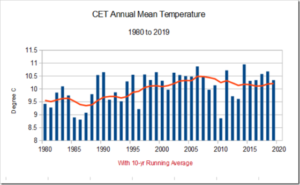
A closer look at the years since 1980 confirms that the 10-year average has been falling since 2006:

2019 Science Refutes Climate Alarm On Every Front… Shrinking Deserts, Growing Islands, Crumbling Consensus, Weaker Storms, Cooler Arctic Etc. Etc. Etc.

by P. Gosselin, December 31, 2019 in NoTricksZone


2019 science: Absolutely no climate alarm 

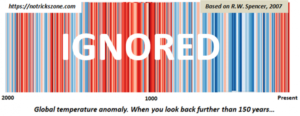
No alarm on every aspect: stable polar ice, normal sea level rise, no consensus, growing snow cover, less tropical storms, tornadoes, shrinking deserts, global greening, predictions wrong, models flawed, climate driven by sun, ocean cycles, biodiversity, warmer 1000 years ago…etc…

2019 saw a great amount of new science emerge showing that there’s nothing alarming or catastrophic about our climate. 

Some 2019 scientific findings

Need to make a presentation showing there is no climate alarm? The following findings we reported on in 2019 will put many concerns to rest.

Hundreds of peer-reviewed papers ignored by media

What follows are some selected top science-based posts we published here at NoTricksZone in 2019. These new findings show there is absolutely no climate alarm.

Hundreds of new peer-reviewed papers, charts, findings, etc – which the IPCC, activists and media ignore and even conceal. No wonder they’ve gotten so shrill.

January 2019

….