CHILLING 1200-YEAR-OLD VIKING STONE WARNS OF FUTURE LITTLE ICE AGES

by Cap Allon, January 18, 2020 in Electroverse


A secret code unsolved for 1200 years has finally been cracked — the mysterious inscription on famed Viking relic the Rök stone (or Rökstenen) reveals the warrior nation feared the return of the deadly ‘Late Antique Little Ice Age’ which wiped out more than HALF of Scandinavia — the stone speaks of an enduring battle against extreme cold weather in the sixth century.

According to a study led by Per Holmberg, a professor of Swedish language at the University of Gothenburg, the text is telling a tale of light and darkness, warmth and cold, and it expresses a deep fear of a coming climate disaster.

“The main theme is apparently the Sun, or the rhythm of light”, Holmberg explained.

Of the nine riddles contained on the stone, five of them have the answer “the Sun.”


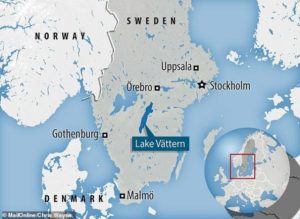
The stone was erected in the late 800s near the lake Vattern in south central Sweden.

New 80-Year Deep-Ocean Temperature Dataset Compared to a 1D Climate Model

by Roy Spencer, January 15, 2020 in WUWT/Ch.Rotter


The increasing global ocean heat content (OHC) is often pointed to as the most quantitative way to monitor long-term changes in the global energy balance, which is believed to have been altered by anthropogenic greenhouse gas emissions. The challenge is that long-term temperature changes in the ocean below the top hundred meters or so become exceedingly small and difficult to measure. The newer network of Argo floats since the early 2000s has improved global coverage dramatically.

A new Cheng et al. (2020) paper describing record warm ocean temperatures in 2019 has been discussed by Willis Eschenbach who correctly reminds us that such “record setting” changes in the 0-2000 m ocean heat content (reported in Zettajoules, which is 10^^21 Joules) amount to exceedingly small temperature changes. I calculate from their data that 2019 was only 0.004 0.009 deg. C warmer than 2018.

Over the years I have frequently pointed out that the global energy imbalance (less than 1 W/m2) corresponding to such small rates of warming is much smaller than the accuracy with which we know the natural energy flows (1 part in 300 or so), which means Mother Nature could be responsible for the warming and we wouldn’t even know it.

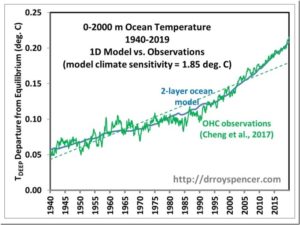
The Cheng (2017) dataset of 0-2000m ocean heat content changes extends the OHC record back to 1940 (with little global coverage) and now up through 2019. The methodology of that dataset uses optimum interpolation techniques to intelligently extend the geographic coverage of limited data. I’m not going to critique that methodology here, and I agree with those who argue creating data where it does not exist is not the same as having real data. Instead I want to answer the question:

If we take the 1940-2019 global OHC data (as well as observed sea surface temperature data) at face value, and assume all of the warming trend was human-caused, what does it imply regarding equilibrium climate sensitivity (ECS)?

Fig. 1. Deep-ocean temperature variations 1940-2019 explained with a 2-layer energy budget model forced with RCP6 radiative forcing scenario and a model climate sensitivity of 1.85 deg. C. The model also matches the 1940-2019 and 1979-2019 observed sea surface temperature trends to about 0.01 C/decade. If ENSO effects are not included in the model, the ECS is reduced to 1.7 deg. C.

19 Papers Published In 2019 Affirm Sea Levels Were METERS Higher Than Today 4-8 Thousand Years Ago

by K. Richard, January 16, 2020 in NoTricksZone


The onslaught of paleoclimate evidence for warmer-than-now Mid-Holocene climates – when the Earth’s sea levels were meters higher than they are today –  stormed through 2019.

There were 107 scientific papers published this past year indicating today’s warmth isn’t even close to being unusual or unprecedented when compared to the climates of the last centuries to millennia.

As illustrated below, there were also 19 papers affirming today’s sea levels are among the lowest of the last ~8000 years.

This is added to the list of nearly 100 scientific papers published in the last handful of years indicating Mid-Holocene sea levels were multiple meters higher than they are today due to the much more extensive glacier and ice sheet melt occuring during these millennia.

Throwing More Cold Water On An Alarmist Ocean-Warming Paper

by Dr. D. Whitehouse, January 17, 2020 in ClimateChangeDispatch


It’s the usual story. It’s the beginning of the year and the statistics of the previous year are hurriedly collected to tell the story of the ongoing climate crisis.

First off, we have the oceans which, according to some, are living up to the apocalyptic narrative better than the atmosphere.

The atmosphere is complicated, subjected to natural variabilities, that make the temperature increase open to too much interpretation.

The oceans, however, are far more important than the air as they absorb most of the anthropogenic excess heat.

Looking at the literature reveals no one knows just how much excess heat (created in the atmosphere) it mops up or indeed exactly how or where it does it. Some say it is 60% which is a bit on the low side, most say 90% or 93%.

The real figure is unknown though it should be noted that a few percent errors translate to a lot of energy, about the same amount that is causing all the concern.

On 14 January the Guardian had the headline, “Ocean temperatures hit record high as the rate of heating accelerates.” The study that reached this conclusion was published in the journal Advances in Atmospheric Sciences.

It’s a badly written paper full of self-justifying statements and unwarranted assumptions that should have been stripped-out by the editor.


Also : Ocean Warming: Not As Simple As Headlines Say

Les Feux en Australie : la réalité des faits et rien d’autre…

by Yannick Colleu, 17 janvier 2020 in ScienceClimatEnergie


Les feux de brousse en Australie font la une des journaux écrits et audiovisuels. Ces annonces sont reprises par les réseaux sociaux.
La vérité médiatique est maintenant bien établie, ces feux sont l’œuvre du dérèglement climatique. Ces catastrophes humaine et écologique présagent, selon les réseaux dits sociaux, la fin du Monde annoncée par les « experts » du GIEC.

A ma connaissance pas un seul journaliste ne semble s’être penché sur le sujet. Du moins aucune autre conclusion, quant aux causes de cette catastrophe, n’a été, à ma connaissance, publiée sinon pour pointer le changement climatique comme seul et unique coupable.

Pourtant la réponse est moins évidente.

Il est de notoriété publique que l’Australie est un pays coutumier des sécheresses et des températures extrêmes. En outre c’est un pays quasi désertique de 7,7 millions de km² peuplé d’à peine 25 millions d’habitants principalement implantés dans les grandes villes de la côte Est et dans la principale métropole de l’Ouest.

Après les gigantesques feux de brousse de janvier à mars 1961 en Australie occidentale les réflexions sur les actions de prévention conduisaient à préconiser l’usage de feux déclenchés/contrôlés pour maîtriser la végétation à l’approche de la saison sèche. Cette technique permet en effet de créer des coupe-feux et de limiter la matière inflammable qui nourrit les brasiers.

Cette politique préventive a longtemps porté ses fruits, réduisant considérablement les incendies et surtout leur propagation. Néanmoins les chantres de la lutte contre le réchauffement et le CO2 ont poussé le gouvernement australien à changer de politique il y a une dizaine d’années (par exemple ici et ici).

La politique actuelle ne privilégie plus l’anticipation du risque d’incendie mais préconise de laisser les incendies se propager et de ne défendre autant faire se peut que les habitations et les vies humaines.
De fait la végétation n’est plus façonnée par l’homme pour limiter les risques de propagation et celle-ci offre dès lors un combustible abondant au moindre foyer qui se développe.

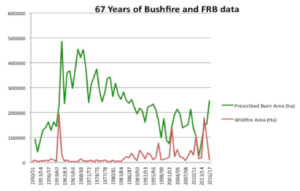
Le graphique ci-dessous fournit par l’association Bushfire Front Inc (BFF) de l’État d’Australie occidentale révèle l’impact que cet abandon d’une politique de prévention sur les feux de brousse sur la période 1950-2017.

En vert : surface de feux déclenchés.
En rouge : surface de feux de brousse


Source : https://www.bushfirefront.org.au/prescribed-burning/why-prescribed-burning/
Légende : La zone d’incendie contrôlé (réduction de ‘carburant’) est indiquée en vert et la zone des feux de brousse (feux de forêt) en rouge. Les pics causés par désastreuse saison des incendies de 1961 et les grands feux de brousse de ces dernières années sont clairement visibles.

Breakthrough gives insight into early complex life on Earth

by H. Devlin, January 15, 2020 in TheGuardian


For the first 2 billion years, life on Earth comprised two microbial kingdoms – bacteria and archaea. They featured an innumerable and diverse variety of species, but, ultimately, life on Earth was not that exciting judged by today’s standards.

Then, the theory goes, a rogue archaeon gobbled up a bacterium to create an entirely new type of cell that would go on to form the basis of all complex life on Earth, from plants to humans.

Now, for the first time, scientists have succeeded in culturing an elusive species of archaea believed to be similar to the ancestor that gave rise to the first sophisticated cells, known as eukaryotes. The work has been described as a “monumental” advance that sheds new light on this evolutionary milestone.

Nick Lane, professor of evolutionary biochemistry at UCL, described the work as “magnificent”, while a commentary by two other experts in the field said it marked a “huge breakthrough for microbiology”.

Like bacteria, archaea continue to thrive on Earth today. But despite the pivotal role they are thought to have played in the emergence of complex life there has been relatively little research on them. Many species are found in inhospitable environments and are incredibly difficult to grow in the lab.

The Japanese team behind the latest advance has dedicated 12 years to the effort, overcoming a series of setbacks along the way.

The archaeon which was cultured and characterised from deep marine sediment. Photograph: Nature


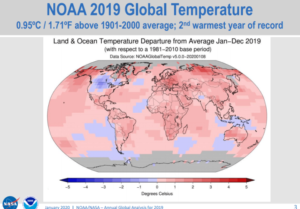
While NOAA/NASA claims 2019 as the “second warmest year ever”, other data shows 2019 cooler than 2005 for USA.

by Anthony Watts, January 15, 2020 in WUWT


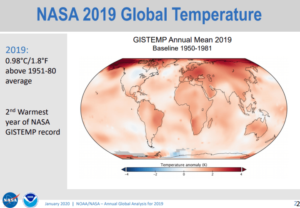
Today, at the big 100 year anniversary shindig of the American Meteorological Society (AMS) there was a press release session that featured NOAA and NASA GISS talking about how their climate data says that the world in 2019 was the second warmest ever.

Here is their slideshow presentation, released today: https://www.ncdc.noaa.gov/sotc/briefings/20200115.pdf

In my opinion, the NOAA/NASA press release (and slideshow) is inconsistently presented. For example, they can’t even agree on a common base period for comparisons. Some graphs use 1951-1980 while others compare to 1981-2010 averages to create anomaly plots. NOAA and NASA owe it to the public to present climate data with a consistent climate period for comparison, otherwise it’s just sloppy science. NASA GISS has consistently resisted updating the 1951-1980 NASA GISS baseline period to the one NOAA and other datasets use, which is 1981-2010. GISS stubbornly refuses to change even though they have been repeatedly excoriated for keeping it.

That 1951-1980 period just so happens to be the coolest period in the 20th century, so by using that as a baseline, the peak amount of warming anomaly is magnified in NASA GISS plots. Most laymen will never spot this. A simple comparison of the two maps show the difference in the peak values:


Transition énergétique : une régression sans précédent ?

par J.P. Bardinet, 16 janvier 2020 in Contrepoints


L ’éolien ne sert à rien et la politique gouvernementale, voulue par l’Union européenne, Emmanuel Macron et ses deux prédécesseurs, est néfaste pour notre pays.

Lors de son évolution, l’humanité a utilisé des énergies primaires avec des densités énergétiques de plus en plus fortes : bois, charbon, gaz, pétrole, uranium. La densité énergétique des énergies renouvelables (EnR), éolien et solaire, est très faible, ce qui est une régression sans précédent dans l’histoire de l’humanité.

Chiffres de production totale RTE 2018 : 548,6 TWh dont

  • nucléaire 71,7 %
  • thermique à combustible fossile 7,2 %
  • hydraulique 12,5 %
  • éolien 5,1 %
  • solaire 1,9 %
  • agroénergies 1,8 %

Le facteur de charge de l’éolien est de 21 % et celui du solaire de 13,6 %.

Ces EnR intermittentes ont de faibles facteurs de charge, ce sont donc des moyens de production peu efficaces, mais particulièrement onéreux.
L’Espagne et l’Allemagne en ont fait la douloureuse expérience.

Avant le développement des EnR intermittentes, nous exportions environ 10 % de notre production d’électricité. Nous pouvons donc nous demander pourquoi nos gouvernants, à la suite des Directives de la Commission européenne, ont imposé  manu militari ces EnR intermittentes alors qu’une politique de prolongation de la durée de vie des centrales nucléaires, un programme de construction de plusieurs EPR, et un financement approprié de la R&D sur la surgénération à uranium appauvri auraient été les meilleures options.

La filière des SMR (small size reactors) qui utilise la technologie des sous-marins nucléaires, serait également une piste à développer, car elle permettrait de produire de l’électricité à proximité des centres de consommation, rendant ainsi les pertes lors du transport quasiment nulles.

LE CO2 LOURDEMENT TAXÉ

Les politiques climat-énergie de notre pays et de la plupart de pays de l’UE sont basées sur l’hypothèse non prouvée que nos émissions de CO2 ont une action mesurable sur la température moyenne annuelle globale (TMAG) et sur le climat de notre planète.


IPCC Expert’s 8 Discredited Papers

by Donna Laframboise, January 12, 2020 in BigPicturesNews


Philip Munday’s work falls to pieces whenever someone tries to verify it.

Last week, Nature published a damning refutation of a significant body of climate change research. The title of that article is self-explanatory: Ocean acidification does not impair the behaviour of coral reef fishes.

The authors studied more than 900 fish from six different species over a period of three years, attempting to verify earlier findings by a team of researchers at Australia’s James Cook University. Their attempts failed.

Scholarly convention being what it is, the now-discredited work isn’t identified in a clear manner. Readers are compelled to sift through footnotes to locate the “several high-profile papers” that are being refuted. So here they are:

….

Continuer la lecture de IPCC Expert’s 8 Discredited Papers

How nodules stay on top at the bottom of the sea

by Geological Society of America, January 13, 2020 in ScienceDaily


Rare metallic elements found in clumps on the deep-ocean floor mysteriously remain uncovered despite the shifting sands and sediment many leagues under the sea. Scientists now think they know why, and it could have important implications for mining these metals while preserving the strange fauna at the bottom of the ocean.

The growth of these deep-sea nodules — metallic lumps of manganese, iron, and other metals found in all the major ocean basins — is one of the slowest known geological processes. These ringed concretions, which are potential sources of rare-earth and other critical elements, grow on average just 10 to 20 millimeters every million years. Yet in one of earth science’s most enduring mysteries, they somehow manage to avoid being buried by sediment despite their locations in areas where clay accumulates at least 100 times faster than the nodules grow.

Understanding how these agglomerations of metals remain on the open sea floor could help geoscientists provide advice on accessing them for industrial use. A new study published this month in Geology will help scientists understand this process better.

“It is important that any mining of these resources is done in a way that preserves the fragile deep-sea environments in which they are found,” said lead author Adriana Dutkiewicz, an ARC Future Fellow in the School of Geosciences at The University of Sydney.

Rare-earth and other critical elements are essential for the development of technologies needed for low-carbon economies. They will play an increasingly important role for next-generation solar cells, efficient wind turbines, and rechargeable batteries that will power the renewables revolution.

The Ocean Warms By A Whole Little

by Willis Eschenbach, January 4, 2020 in WUWT


How much is a “Whole Little”? Well, it’s like a whole lot, only much, much smaller.

There’s a new paper out. As usual, it has a whole bunch of authors, fourteen to be precise. My rule of thumb is that “The quality of research varies inversely with the square of the number of authors” … but I digress.

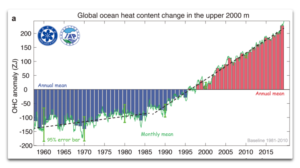
In this case, they’re mostly Chinese, plus some familiar western hemisphere names like Kevin Trenberth and Michael Mann. Not sure why they’re along for the ride, but it’s all good. The paper is “Record-Setting Ocean Warmth Continued in 2019“. Here’s their money graph:


Figure 1. Original Caption: “Fig. 1. (a) Upper 2000 m OHC from 1955 through 2019. The histogram represents annual anomalies (units: ZJ), wherein positive anomalies relative to a 1981−2010 baseline are shown as red bars and negative anomalies as blue. The two black dashed lines are the linear trends over 1955–86 and 1987−2019, respectively.”


So here’s the hot news. According to these folks, over the last sixty years, the ocean has warmed a little over a tenth of one measly degree … now you can understand why they put it in zettajoules—it’s far more alarming that way.

Next, I’m sorry, but the idea that we can measure the temperature of the top two kilometers of the ocean with an uncertainty of ±0.003°C (three-thousandths of one degree) is simply not believable.

Also Ocean Warming Scares

Also : New 80-Year Deep-Ocean Temperature Dataset Compared to a 1D Climate Model

Weak El Nino Conditions Help Explain Recent Global Warmth

by Dr. Roy Spencer,  January 13, 2020 in WUWT


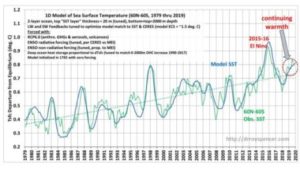
The continuing global-average warmth over the last year has caused a few people to ask for my opinion regarding potential explanations. So, I updated the 1D energy budget model I described a couple years ago here with the most recent Multivariate ENSO Index (MEIv2) data. The model is initialized in the year 1765, has two ocean layers, and is forced with the RCP6 radiative forcing scenario and the history of El Nino and La Nina activity since the late 1800s.

The result shows that the global-average (60N-60S) ocean sea surface temperature (SST) data in recent months are well explained as a reflection of continuing weak El Nino conditions, on top of a long-term warming trend.

Fig. 1. 1D model of global ocean temperatures compared to observations. The model is forced with the RCP6 radiative forcing scenario (increasing CO2, volcanoes, anthropogenic aerosols, etc.) and the observed history of El Nino and La Nina since the late 1800s. The observations are monthly running 3-month averages and are offset with a single bias to match the model temperatures, which are departures from assumed energy equilibrium in 1765.

2019 Alaska aerial survey found the most polar bears since 2012 – dozens of fat healthy bears

by Polar Bear Science, January 12, 2020 in WUWT


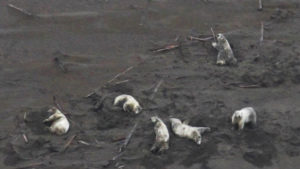
This aerial shot of six fat polar bears lolling around on a sand beach on the coast of the Southern Beaufort Sea, Alaska, was taken by NOAA employees in July 2019. It exemplifies the reality that bears in this subpopulation are currently abundant and healthy, negating the suggestion that numbers have continued to drop since 2006 because bears are starving.

The above picture of polar bear health is not an exception but the rule for all 31 bears recorded onshore last July, as the photos below from other locations testify. Those who would blame this abundance of bears on lack of sea ice in 2019 should note that ice retreated as early and as extensively in 2017 yet only 3 bears were spotted onshore. Results of a recent (2017-2018) population survey, which have not yet been made public, will of course not reflect conditions seen in 2019.

Canada’s Missing Heat: Stations Across The Country Show More Cooling Than Warming

by Kirye, January 12, 2020 in NoTricksZone


Global warming alarmists like claiming that a certain place is seeing more warming and climate change than everywhere else. Remarkably, they say that about almost everywhere, which of course makes no sense.

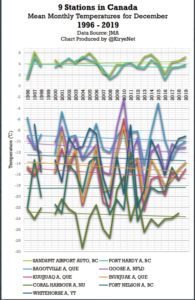
Today we look at Canadian temperature trends using the data from the Japan Meteorological Institute (JMA) for stations where they have data available going back to at least the mid 1990s.

First we look at December mean temperatures. What follows is a chart depicting the results of 9 stations across Canada:


Of the 9 examined stations, seven show no warming taking place at all in Canada over the past quarter century for the month of December. Data: JMA.

Lettre ouverte aux informateurs royaux Georges-Louis Bouchez et Joachim Coens.

by A. Berger & S. Furfari, 11 janvier 2020 in LeVIfL’Express


Messieurs les informateurs royaux,

L’année qui se termine a atteint des sommets de désinformation en matière de climat et de son corollaire, l’énergie, sommets qui frisent la manipulation. Les deux auteurs de cette carte blanche ne sont pas nécessairement d’accord sur toutes les questions à l’entour de ces débats, mais ils le sont sur un double triste constat. D’une part, l’hystérie actuelle n’est ni appropriée, ni constructive. D’autre part, les solutions proposées pour contrer le changement climatique ne sont pas adaptées.

Continuer la lecture de Lettre ouverte aux informateurs royaux Georges-Louis Bouchez et Joachim Coens.

Actualité Débats Kervasdoué – Quelques vérités sur la biodiversité

by Jean de Kersvasdoué, 6 janvier 2020 in LePoint


Derrière une bataille de chiffres alarmistes se cachent des biais statistiques et des questions de fond sur ce que l’on entend par « biodiversité ».


À l’occasion des vœux à la nation, le président de la République, Emmanuel Macron, a déclaré vouloir « œuvrer en faveur de la biodiversité ». Cet objectif est noble pour de multiples raisons et, notamment, parce que certaines espèces de grands mammifères sont menacées mais aussi quelques plantes et animaux de la métropole. Les grands singes, le rhinocéros noir sont en voie d’extinction. En ce qui concerne ce dernier, selon l’UICN, il n’en restait que 5 055 têtes en 2012. Or ces animaux continuent d’être chassés pour les prétendues valeurs aphrodisiaques de leur corne revendue 40 000 dollars le kilo à Shanghai. On comprend pourquoi les braconniers les recherchent et trouvent des complicités chez des gardes mal payés qui, en outre, risquent leur vie en s’opposant aux auteurs de ces regrettables massacres. A contrario, certaines espèces que l’on croyait disparues à l’état sauvage renaissent, comme la perruche de l’île Maurice ou l’oryx d’Arabie. Toutefois, en la matière, les bonnes nouvelles sont rares et la liste des espèces menacées à l’état sauvage s’allonge dans le monde du fait de la croissance de la population de la planète et de la mise en culture d’espaces jusque-là occupés par la forêt. Des écosystèmes disparaissent et avec eux végétaux et animaux qui y vivaient. Si donc préserver ces espèces est un objectif louable, il concerne rarement la France à l’exception des forêts de Guyane, mais il la touche cependant.

En France métropolitaine, le nombre de plantes supérieures, à fleurs, dites « phanérogames », donc hors champignons, mousses, fougères, lichens, algues, etc., du territoire métropolitain est d’environ 5 000 espèces sauvages ou cultivées. Pour les vertébrés, on y trouve de l’ordre de 40 poissons d’eau douce, 40 amphibiens (ou batraciens), 40 reptiles (serpents, lézards, tortues), 400 oiseaux en comptant des migrateurs qui ne nichent pas sur le territoire national, et 80 mammifères. Au total : environ 600 vertébrés. Donc, en additionnant les végétaux supérieurs et les animaux supérieurs, au sens de l’évolution darwinienne, 5 600 espèces en France. La très grande majorité n’est pas menacée et les espèces qui sont prétendues l’être (1) ne le sont pas toujours.

L’exagération est la règle

Sur les six espèces décrites comme pouvant disparaître, il y a une plante (l’orchis couleur de lait) et cinq animaux (la sterne de l’Arctique, le lynx boréal, la grenouille des champs, la tortue d’Hermann et l’anguille). On trouve l’orchis couleur de lait dans le sud de la France et en Corse, il est difficile de mesurer la réalité de la menace qui pèse sur elle (2), faute de méthode de recensement. En ce qui concerne les espèces animales, deux ne sont en rien menacées (la sterne et le lynx boréal). Si la grenouille des champs l’est dans notre pays, elle ne l’est pas ailleurs en Europe à l’exception de la grenouille des Pyrénées. Restent la tortue d’Hermann et l’anguille européenne.

La tortue d’Hermann est la seule espèce de tortue terrestre de France. Elle est présente dans le Var et en Corse. Son habitat est détruit par les feux de forêt, le débroussaillage, le morcellement des parcelles, les routes et l’habitat pavillonnaire. Quant à l’anguille européenne (Anguilla anguilla), autrefois abondante dans tous les cours d’eau et les zones humides (lacs, étangs, marais, mares, fossés), son déclin se constate depuis 40 ans. Cette régression provient de plusieurs facteurs : divers contaminants toxiques (pesticides organochlorés bio-accumulés par l’anguille), la surpêche des civelles et des adultes de plus en plus appréciés, le braconnage, les obstacles sur la route des alevins et une augmentation du taux de parasitisme (par le nématode Anguillicola crassus) qui perturbe la migration marine des adultes. Un règlement européen (R(CE) no 1100/2007) impose des mesures de connaissance et de protection et de gestion de l’anguille et semble porter des fruits.

Continuer la lecture de Actualité Débats Kervasdoué – Quelques vérités sur la biodiversité

Despite 1990s Warming, Japan Climate Has Become More Agreeable, Less Extreme Over Past 100 Years!

by Kirye, January 9, 2020 in NoTricksZone


Though the media like to tell their audience that man-made climate change is leading to more extreme weather, the data don’t support it. In fact, one could easily argue that Japan’s climate is more agreeable today.

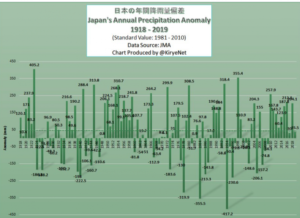
No trend in long-term annual precipitation

Over the past 100 years, for example, annual precipitation has not trended in an particular direction over the long term, showing rather some cyclical attributes:


Data source: Japan Meteorological Agency (JMA). 

If anything, precipitation has been rather steady for the better part of the past 2 decades, and even resembles what was observed about 60 years ago, in the 1950s.

Note how the extremes in precipitation occurred in the 1970s and 1980s when most of the climate talk was about global cooling. But overall, there’s been no trend change in precipitation in Japan.

Typhoons trending downward modestly!

Carbon Sequestration

by Red Istvan, January 10, 2020 in WUWT


As most WUWT readers know, the issue of carbon sequestration is an important but largely IPCC undiscussed ‘anthropogenic global warming’ question. I got to thinking about it again as a result of the Australian brush fires that are dramatically releasing sequestered brush carbon. And it has been years since the topic was discussed in any depth here at WUWT, insofar as I know.

A cautionary note to WUWT readers. This guest post is a high level review, rather than a typically detailed and highly referenced analytic post on some paper. It is intended mainly to guide your own further research into a fairly complex subject by providing basic concepts and keywords.

Background

There is little doubt that combusting fossil fuel raises atmospheric CO2 in the ‘short term’ at some ‘rate’. This is provable several ways including C12/C13 isotope ratios governed by the differential photosynthetic uptake of the atomically lighter, therefore more ‘reactive’, C12. The experimental proof is simple: as fossil fuel combustion releases more photosynthetically sequestered C12, the residual atmospheric fraction of heavier (so less sequestered) C13 should decline. It does.

The relevant questions for global warming are the meanings of ‘rate’ and ‘short term’. We know the present rate from the Keeling Curve. That curve shows biological sink seasonality (mainly northern hemisphere terrestrial, because plants don’t grow in winter), and surprisingly slight acceleration—much less than the estimated rate of increase in gross CO2emissions from fossil fuel consumption. (Wiki has good illustrations and discussion.) This belies the ‘saturated sinks’ assumption in the Bern sequestration model because the simple gross/net comparison shows carbon sinks must be growing significantly.

We also know from that same Keeling curve that ‘short term’ is at least decades. But is it several centuries as all the IPCC AR5 climate models predict?

Different Carbon Sink Rates

.

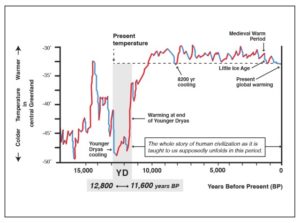
YOUNGER DRYAS — REWIND AND REPEAT

by Poppaloff, January 10, 2020 in Electroverse


If the historical data is anything to go by, magnetic reversals/excursions often lead to large-level extinction events. Mounting evidence also suggests that our sun micro-novas every 12,000 years, or thereabouts, and that these two events are linked. Earth’s temperature has been on a downward trend since the sharp-warming that followed the end of the Younger Dryas, indicating that this coming Grand Solar Minimum could steer us back into a major glaciation period, and another extinction event.

In their 2014 paper, a group of scientists which included UC Santa Barbara’s James Kennett, posited that a comet collision with Earth played a major role in the extinction. Their hypothesis suggests that a cosmic-impact-event caused the Younger Dryas period of global cooling close to 12,800 years ago. This cosmic impact resulted in abrupt environmental stress and degradation that contributed to the extinction of most large animal species then inhabiting the Americas. According to Kennett, the catastrophic impact and the subsequent climate change also led to the disappearance of the prehistoric Clovis culture, known for its big game hunting, and to human population decline.


Ocean acidification a big problem — but not for coral reef fish behavior

by Norwegian University of Science and Technology, Jan. 9, 2020 in WUWT


A three-year, comprehensive study of the effects of ocean acidification challenges previous reports that a more acidic ocean will negatively affect coral reef fish behaviour.

The study, conducted by an international coalition led by scientists from Australia and Norway, showed that coral reef fish exposed to CO2 at levels expected by the end of the century did not change their activity levels or ability to avoid predators.

“Contrary to previous studies, we have demonstrated that end-of-century CO2 levels have a negligible impact on the behaviour and sensory systems of coral reef fish,” said Timothy Clark, the lead author of the study and an associate professor at Deakin University in Australia.

Although this is good news on its own, ocean acidification and global warming remain a major problem for coral reefs, the researchers said. Ocean acidification is a problem for creatures that rely on calcium carbonate to make shells and skeletons, such as coral reef organisms, while higher ocean temperatures lead to coral bleaching and death.

..

False Alarm: Glacier National Park Changes ‘Gone By 2020’ Signs

by Chris White, January 9, 2020 in ClimateChangeDispatch


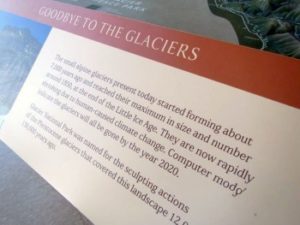
Officials who manage Glacier National Park are swapping out signs warning visitors that climate change would cause the park’s glaciers to disappear by 2020.

The U.S. Geological Survey told the park in 2017 that the complete melting off of the glaciers was no longer expected, park spokeswoman Gina Kurzmen told CNN.

Forecast models over the years show the glaciers were no longer at risk of disappearing by that date, she noted.

Placards at the St. Mary’s Visitor Center, located in Montana’s mountain ranges, were reportedly changed in 2019. The park is waiting for budget authorization to update the park’s full set of signs, Kurzman noted.

The signs will be changed to say: “When they will completely disappear depends on how and when we act. One thing is consistent: the glaciers in the park are shrinking.”

SEE ALSO: National Park Stealth Removes Warning That All Glaciers Will Be Gone By 2020

SEE ALSO: Himalayan Glacier Loss Caused By Many Factors, Not Just Warming

USGS noted in a report to the Daily Caller News Foundation in 2019 that recent harsh winters had significantly changed forecasts from years past.

“Glacier retreat in Glacier National Park speeds up and slows down with fluctuations in the local climate,” a representative with the USGS told the DCNF at the time. The agency is responsible for managing the park.

“Subsequently, larger than average snowfall over several winters slowed down that retreat rate and the 2020 date used in the NPS display does not apply anymore,” the representative said.


Also : National Park Stealth Removes Warning That All Glaciers Will Be Gone By 2020

The Climate Decade that Was: Failed Predictions, Tour De Paris, and the Gretas

by  V. Jayaraj, January 8, 2020 in WUWT


As we step into a new decade, here’s a look at the climate drama that just ended.

The 2010s were dominated by the failure of doomsday prophecies, the adoption of a fantasy climate agreement, unexpected weather trends, and the beginning of the climate emergency cult movement that reminded many of the overpopulation hype of the 1970s and 1980s.
Al Gore Prophecies

Al Gore’s legacy of lies continued to spill into the second decade of this century. Contrary to his predictions in the famous climate documentary An Inconvenient Truth, polar bear populations increased, the Arctic and Antarctic remained relatively unaffected, and no major coastal economy was threatened by rising sea levels.

Gore would have had nightmares when the Canadian authorities in 2019 pondered culling polar bears because of their excess numbers caused trouble for residents in Nunavut.


Continuer la lecture de The Climate Decade that Was: Failed Predictions, Tour De Paris, and the Gretas

800,000 Years Ago, a Meteor Slammed Into Earth. Scientists Just Found the Crater.

by M. Weisberger, January 7, 2020 in LiveScience


About 790,000 years ago, a meteor slammed into Earth with such force that the explosion blanketed about 10% of the planet with shiny black lumps of rocky debris. Known as tektites, these glassy blobs of melted terrestrial rock were strewn from Indochina to eastern Antarctica and from the Indian Ocean to the western Pacific. For more than a century, scientists searched for evidence of the impact that created these pitted blobs.

But the crater’s location eluded detection — until now.

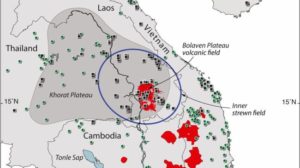
Geochemical analysis and local gravity readings told researchers that the crater lay in southern Laos on the Bolaven Plateau; the ancient impact was concealed under a field of cooled volcanic lava spanning nearly 2,000 square miles (5,000 square kilometers), the scientists reported in a new study.

Was the crater buried? On Laos’ Bolaven Plateau, the scientists found a site where fields of volcanic lava might have hidden signs of an older meteor impact. In a region that the researchers targeted as a likely spot for a crater, most of the lava flows were also in the right age range: between 51,000 and 780,000 years old.

In this geological map of the volcanic field’s summit region, the dashed, yellow ellipse marks the buried crater perimeter for the best-fitting gravity model. The dashed, white circle marks the buried perimeter that best fits geological observations. (Image credit: Sieh et al./PNAS 2019)

The study authors peered below the lava’s surface by taking gravity readings at more than 400 locations. Their resulting gravity map showed one area “of particular interest” with a gravitational anomaly, a subsurface zone less dense than the volcanic rock surrounding it. Their measurements hinted at an elliptical, “elongated crater” about 300 feet (100 m) thick, about 8 miles (13 km) wide and 11 miles (17 km) long, according to the study.

Together, all of these clues suggested that “this thick pile of volcanic rocks does indeed bury the site of the impact,” the scientists wrote.

The findings were published online Dec. 30 in the journal Proceedings of the National Academy of Sciences.

Climate Change, Lies And The Lancet

by P. Homewood, January 7, 2020 in ClimateChangeDispatch


The Lancet has published its latest annual report on health and climate change, which inevitably orders us to stop using fossil fuels or the kids will get it!

It is the usual load of overhyped rubbish of the sort we have seen in previous years.

The executive summary contains a number of questionable claims and statements which seriously undermine the report’s integrity and reliability.

For a start, it claims that ‘a child born today will experience a world that is more than four degrees warmer than the pre-industrial average.’

Really? A temperature rise of three degrees in 50 years or so? Even the highly discredited climate models don’t regard this as realistic. For the Lancet to state this as a bald-faced fact calls into question the objectivity of its contents.

It then proceeds to list all sorts of ways in which health is already being impacted by climate change, including disease transmission, air pollution, extreme weather (which apparently will affect women more – yes, that’s got me and all!), wildfires, heatwaves and goodness knows what else.

Yet, tucked away in Figure 5 is the dirty little secret that mortality rates from climate-related causes have been plummeting since 1990.

Greenland Ice Core CO2 Concentrations Deserve Reconsideration

by Renee Hannon, January 7, 2020, in WUWT


Introduction
Ice cores datasets are important tools when reconstructing Earth’s paleoclimate. Antarctic ice core data are routinely used as proxies for past CO2 concentrations. This is because twenty years ago scientists theorized Greenland ice core CO2 data was unreliable since CO2trapped in air bubbles had potentially been altered by in-situ chemical reactions. As a result, Greenland CO2 datasets are not used in scientific studies to understand Northern and Southern hemispheres interactions and sensitivity of greenhouse gases under various climatic conditions.

This theory was put forward because Greenland CO2 data were more variable and different than Antarctic CO2 measurements located in the opposite polar region about 11,000 miles away. This article re-examines Greenland ice cores to see if they do indeed contain useful CO2 data. The theory of in-situ chemical reactions to explain a surplus and deficit of CO2, relative to Antarctic data, will be shown to be tenuous. The Greenland CO2 data demonstrates a response to the Medieval Warm Period, Little Ice Age, Dansgaard-Oeschger and other past climate change events. This response to past climate changes offers an improved explanation for why Greenland and Antarctic CO2 measurements differ. Further, Greenland CO2 measurements show rapid increases of 100 ppm during warm events in relatively short periods of time.

Atmospheric CO2 is More Variable in Northern Latitudes

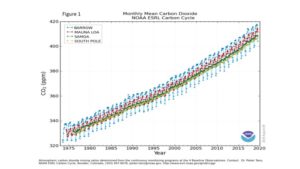
Figure 1, from NOAA, shows atmospheric CO2 concentrations measured from the continuous monitoring program at four key baseline stations spanning from the South Pole to Barrow, Alaska. CO2 has risen from about 330 ppm to over 400 ppm since 1975 and is increasing at approximately 1-2+ ppm/year. Many scientists believe that rapidly increasing CO2 is mostly due to fossil fuel emissions.

Figure 1. Atmospheric CO2 concentrations from NOAA