Study: As Sea Levels Rise, Island ‘Drowning’ Is Not Inevitable

by A. Williams, June12, 2020 in ClimateChangeDispatch


Coral reef islands across the world could naturally adapt to survive the impact of rising sea levels, according to new research.

The increased flooding caused by the changing global climate has been predicted to render such communities – where sandy or gravel islands sit on top of coral reef platforms – uninhabitable within decades.

However, an international study led by the University of Plymouth (UK) suggests that perceived fate is far from a foregone conclusion.

The research, published in Science Advances, for the first time uses numerical modeling of island morphology alongside physical model experiments to simulate how reef islands – which provide the only habitable land in atoll nations – can respond when sea levels rise.

THE CHANGING JET STREAM AND GLOBAL COOLING

by Cap Allon, June12, 2020 in Electroverse


Studying the JET STREAM has long been an indicator of the weather to come. And to study the jet stream attention must turn to the SUN.

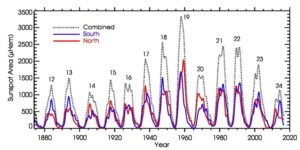
When solar activity is HIGH the jet stream is tight, stable, and follows somewhat of a straight path. But when solar activity is LOW that meandering band of air flowing some 6 miles above our heads becomes weak and wavy, it effectively buckles, which has the effect of diverting frigid Polar air to atypically low latitudes and replaces it with warmer tropical air masses.

The jet stream reverts from a Zonal Flow to a Meridional Flow — and, depending on which side of the jet stream you’re on, you’re either in for a spell of unseasonably cold or hot weather, and/or a period of unusually dry or wet conditions.


Observations historiques d’inondations jusqu’à la fin du 19ème siècle (première partie)

by IRM, 2020


Nos observations historiques d’inondations font l’objet de trois articles. Voici le premier qui traite des inondations jusqu’à la fin du 19ème siècle.

En août 2019, nous avons introduit la possibilité d’envoyer vos propres observations via notre application météo. Cette nouvelle fonctionnalité semble avoir plu aux utilisateurs de notre app, puisque nous avons reçu près de 600.000 observations jusqu’à présent ! Etant donné ce succès, nous avons décidé en avril 2020 d’y ajouter deux nouveaux types d’observations à rapporter : les inondations et les phénomènes optiques. Ces phénomènes ont été observés de tous temps, c’est pourquoi nous avons décidé de nous plonger dans plus d’un millénaire d’anciennes observations de halos et d’arcs-en-ciel. Dans ce nouvel article, vous trouverez quelques observations d’inondations telles qu’elles ont été perçues et décrites dans d’anciens manuscrits, livres et journaux publiés en Europe de l’Ouest jusqu’au 19ème siècle.

Caricature représentant l’actuelle place Saint-Géry, lors de l’inondation de janvier 1820, Collection iconographique (ref. K-573), Archives de la Ville de Bruxelles.


See also Observations historiques d’inondations (deuxième partie)

and Observations historiques d’inondations (troisième partie)

Podcast: Why the Oceans Really Aren’t “Acidifying” but the Term Is Being Abused by Science and Media

by A. Watts, June 11, 2020 in WUWT


Science and media outlets claim ocean acidification is happening due to increased carbon dioxide in the atmosphere. But objective data show the ocean is far from acidic according to Dr. Caleb Rossiter, executive director of the CO2 Coalition and a statistician who has studied climate change closely.

Host Anthony Watts and Rossiter talk about how a pH of 7 is considered neutral, with anything below 7 considered acidic. Ocean pH averages 8.1, which is alkaline rather than acidic. Although climate models suggest the ocean’s surface pH may have dropped from pH 8.2 to 8.1 since 1750, that change was never actually measured.

The pH drop from 1850 is merely a modeled conjecture. The concept of pH was first introduced by in 1909, and agriculturalists first developed field instruments to measure pH in the 1930s.

ASTONISHING, RECORD-BREAKING GAINS CONTINUE ACROSS THE GREENLAND ICE SHEET — MSM SILENT

by Cap Allon, June 11, 2020 in Electroverse


The month of June is breaking records across the Greenland ice sheet, and not records for warmth and melt –as the mainstream media have trained you to expect– but new benchmarks for COLD and GAINS.

The SMB gains occurring right now across Greenland are truly astonishing.

Data-driven FACTS reveal vast regions to the south have been GAINING RECORD/NEAR-RECORD LEVELS of snow & ice all month.

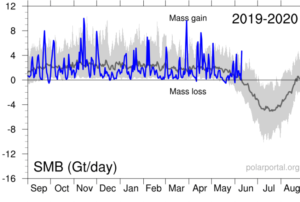
Never before in June has the Greenland ice sheet grown by more than 4 Gigatons in a single day (since 1981 when DMI records began), but now the past week has gone and delivered two such days — June 3, and now yesterday, June 10.

In fact, yesterday’s gains actually neared 5 Gts — you can see from the chart below how anomalous that gain is for the time of year:


Blue line (Gt/day): total daily contribution to the SMB from the entire ice sheet. Grey line: mean value from 1981-2010 (DMI).

DWD Reverses: Admits Data From Germany’s Infamous Ultra-Hot Lingen Weather Station Need To Be Rechecked

by P. Gosselin, June10, 2020 in NoTricksZone


Recently I wrote here how Germany’s now infamous record-setting weather station in Lingen was producing readings that were 2-3°C hotter than surrounding stations, yet the German DWD weather service refused to acknowledge the station was likely producing bad data. Today they admit the station has problems and that they will be moving it to a better location.

Last year’s all-time record high is now in question.

Lingen’s heated readings

Last summer the Lingen station, located in northwest Germany near the Dutch border, smashed the country’s all-time record high when the ‘mercury’ rose to a scorching 42.6°C during a late July heat wave. The previous all-time high for Germany was a comparatively cool 40.3°C.


Lingen’s readings of late July 2019 compared to other stations in the surrounding region (July 23 – July 27).

Impact-induced amino acid formation on Hadean Earth and Noachian Mars

by Takeuchi et al., June8, 2020 in SciReports Open Access


Abstract

Abiotic synthesis of biomolecules is an essential step for the chemical origin of life. Many attempts have succeeded in synthesizing biomolecules, including amino acids and nucleobases (e.g., via spark discharge, impact shock, and hydrothermal heating), from reduced compounds that may have been limited in their availabilities on Hadean Earth and Noachian Mars. On the other hand, formation of amino-acids and nucleobases from CO2 and N2 (i.e., the most abundant C and N sources on Earth during the Hadean) has been limited via spark discharge. Here, we demonstrate the synthesis of amino acids by laboratory impact-induced reactions among simple inorganic mixtures: Fe, Ni, Mg2SiO4, H2O, CO2, and N2, by coupling the reduction of CO2, N2, and H2O with the oxidation of metallic Fe and Ni. These chemical processes simulated the possible reactions at impacts of Fe-bearing meteorites/asteroids on oceans with a CO2 and N2 atmosphere. The results indicate that hypervelocity impact was a source of amino acids on the Earth during the Hadean and potentially on Mars during the Noachian. Amino acids formed during such events could more readily polymerize in the next step of the chemical evolution, as impact events locally form amino acids at the impact sites.

WHY ARE FOSSIL FUELS SO HARD TO QUIT?

by S. Gross, June 2020 in Brookings.Edu


We understand today that humanity’s use of fossil fuels is severely damaging our environment. Fossil fuels cause local pollution where they are produced and used, and their ongoing use is causing lasting harm to the climate of our entire planet. Nonetheless, meaningfully changing our ways has been very difficult.

But suddenly, the COVID-19 pandemic brought trade, travel, and consumer spending to a near-standstill. With billions of people recently under stay-at-home orders and economic activity plunging worldwide, the demand for and price of oil have fallen further and faster than ever before. Needless to say, oil markets have been in turmoil and producers around the world are suffering.

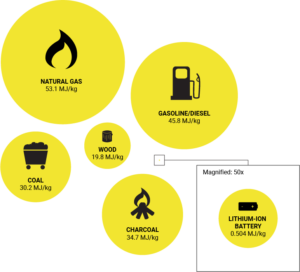
Note: MJ/kg = megajoules per kilogram
Sources: The Engineering Toolbox; Epec Engineered Technologies
 …

Decadal predictability of North Atlantic blocking and the NAO

by Athanasiadis et al., June 3, 2020 in Nature (Open Access)


Abstract

Can multi-annual variations in the frequency of North Atlantic atmospheric blocking and mid-latitude circulation regimes be skilfully predicted? Recent advances in seasonal forecasting have shown that mid-latitude climate variability does exhibit significant predictability. However, atmospheric predictability has generally been found to be quite limited on multi-annual timescales. New decadal prediction experiments from NCAR are found to exhibit remarkable skill in reproducing the observed multi-annual variations of wintertime blocking frequency over the North Atlantic and of the North Atlantic Oscillation (NAO) itself. This is partly due to the large ensemble size that allows the predictable component of the atmospheric variability to emerge from the background chaotic component. The predictable atmospheric anomalies represent a forced response to oceanic low-frequency variability that strongly resembles the Atlantic Multi-decadal Variability (AMV), correctly reproduced in the decadal hindcasts thanks to realistic ocean initialization and ocean dynamics. The occurrence of blocking in certain areas of the Euro-Atlantic domain determines the concurrent circulation regime and the phase of known teleconnections, such as the NAO, consequently affecting the stormtrack and the frequency and intensity of extreme weather events. Therefore, skilfully predicting the decadal fluctuations of blocking frequency and the NAO may be used in statistical predictions of near-term climate anomalies, and it provides a strong indication that impactful climate anomalies may also be predictable with improved dynamical models.

Weather Extremes? Are they caused by global warming?

by Ralph Alexander, June 4, 2020 in CO2Colation


Critical Review Confirms IPCC Assessment On Extreme Weather: “No sign that extreme weather events are getting worse”

The paper, by physicist Dr Ralph Alexander, looks at trends in hot and cold weather extremes, floods and droughts, hurricanes and wildfires and finds only a minor increase in cold weather extremes.

According to Dr Alexander, weather extremes is one area where the IPCC has been reasonably empirical and scientific in recent years.

As he explains:

The IPCC stands out, among those who believe that global warming is primarily due to human activity, as a voice of restraint on the issue of extreme weather. My review is in broad agreement with their position: there is little sign things are getting worse.”

In particular, Dr Alexander points to the underreported global reductions in floods, wildfires and hurricanes, but he cautions that many of the changes are likely to be cyclical.

The key driver for many weather extremes is natural ocean cycles like El Nino and the Atlantic Multidecadal Oscillation. Eventually these cycles will turn, and we should be ready. But we shouldn’t be under any illusion that we can prevent extreme weather by changing our lifestyles”.

Weather Extremes: Are They Caused By Global Warming? (pdf)

COVID-19 Global Economic Downturn not Affecting CO2 Rise: May 2020 Update

by Roy Spencer, June 5, 2020 in GlobalWarming


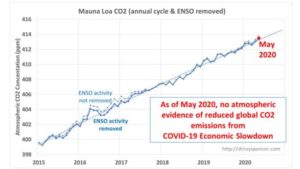
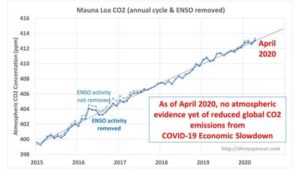
The Mauna Loa atmospheric CO2 concentration data continue to show no reduction in the rate of rise due to the recent global economic slowdown. This demonstrates how difficult it is to reduce global CO2 emissions without causing a major disruption to the global economy and exacerbation of poverty.

After removal of the strong seasonal cycle in Mauna Loa CO2 data, and a first order estimate of the CO2 influence of El Nino and La Nina activity (ENSO), the May 2020 update shows no indication of a reduction in the rate of rise in the last few months, when the reduction in economic activity should have shown up.

I had previously explained why the slowdown would likely not be large enough to affect measured atmospheric CO2 levels compared to natural variations in global sources and sinks of CO2. I calculated that the Energy Information Administration-estimated 11% reductions in CO2 emissions during 2020 would have to be four times larger to stop the rise of atmospheric CO2 over 2019 values (assuming no substantial natural variations in CO2 sources and sinks).

See also

Global Economic Downturn Not Affecting CO2 Rise: May 2020

New Analysis Confirms Extreme Weather Not Getting Worse

by B. Peiser, June 4, 2020 in ClimateChangeDispatch


A new review of the scientific literature on extreme weather events published today by the Global Warming Policy Foundation (GWPF) confirms what IPCC assessment reports have concluded: There is little evidence of any significant changes in most indices.

The paper, by physicist Dr. Ralph Alexander, looks at trends in hot and cold weather extremes, floods and droughts, hurricanes, and wildfires and finds only a minor increase in cold weather extremes.

BBC’s Fake Claim About “Hottest May”

by P. Homewood, June 5, 2020 in NotaLotofPeopleKnowThat


I make no comment about the global numbers, but would simply point out that none of the official agencies have released their data for May. The BBC claim comes from Copernicus, the EU agency, not regarded as a reliable source.

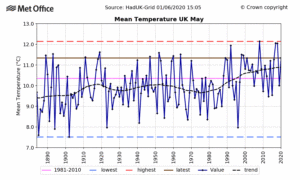
However the BBC claim about the UK is hopelessly wide of the mark. According to the Met Office, last month was only the 15th warmest May since 1884, and was not even as warm as 1893 and 1911!

https://www.metoffice.gov.uk/research/climate/maps-and-data/uk-temperature-rainfall-and-sunshine-time-series

Such sloppy reporting is only too common at the BBC, and not just where climate change is concerned. It only takes a minute to find the Met Office data, and I find it hard to understand why the programme editors did not think it worthwhile checking such an outlandish claim first.

Needless to say, I have filed a complaint, to add to the list of BBC climate lies!!


Models Can’t Accurately Predict Next Week’s Weather, So Why Should We Trust Them To Predict Climate Change?

by D. Turner, June 2, 2020 in WUWT


It’s curious … SpaceX has all the money in the world, and they didn’t hire someone who could have accurately predicted the afternoon weather in Florida on May 27, 2020.  Seems like a huge oversight, doesn’t it?  And to think there are scores of nonprofit leaders and academics in Washington, DC who can accurately predict global temperatures 10, 15, even 50 years into the future.

Oh, stop it with the “climate isn’t weather” rebuttal. It’s trite and silly. The guys who says “food isn’t cuisine” is a food critic, and by default, haughty and obnoxious.

How about this one: science isn’t semantics.

Sunny May–But Only The 48th Warmest

by P. Homewood, June 3, 2020 in NotaLotofPeopleKnowThat


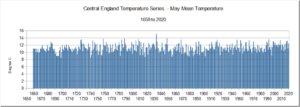
While we’re on with Harrabin’s hysterics about May’s sunny weather being due to climate change, it is appropriate to point out to him that last month was far from being the hottest on record in England:

https://www.metoffice.gov.uk/hadobs/hadcet/data/download.html


In fact there have been 47 hotter Mays since 1659. The hottest was 1833, and the five hottest were all pre 1850.

See also:  UAH Global Temperature Update for May 2020: +0.54 deg. C

Quarantines, Lockdowns Had No Impact On Global CO2 Levels

by Climate at a Glance, June 1, 2020 in ClimateChangeDispatch


The COVID-19, aka Coronavirus pandemic, is causing a worldwide shutdown in economic activity as businesses close, airlines cancel flights, energy production is reduced, and people shelter in their homes and drive less.

Climate activists expected this economic downtown to translate to less energy usage, and therefore less CO2 emissions globally.

While that has indeed happened, with China seeing a 40% emissions drop, and an expected 11% reduction in energy-related CO2 emissions in the U.S. this year, it didn’t translate into the proof they were seeking.

What scientists are looking for is any evidence of a decline in global atmospheric CO2 concentrations that would be strong enough to attribute to the economic downturn.

University of Alabama climate scientist Dr. Roy Spencer used a simple method1 for removing the large seasonal CO2 cycle2, due to plant photosynthesis increases/decreases with seasons, from the Mauna Loa CO2 data, and well as the average effects from El Nino and La Nina events, which change the rate of ocean outgassing of CO2.

The result: no obvious downtown in global CO2 levels has been observed3,4.

As can be seen in Figure 1, the latest CO2 data show no downtrend, but instead just a ripple, that is not unlike other ripples in the graph when there was no crisis and resulting economic downturn.

Figure 1: Using a simple method1 for removing the large seasonal cycle from the Mauna Loa CO2 data, and well as the average effects from El Nino and La Nina events, no obvious downtown in global CO2 levels has been observed4. Analysis by Dr. Roy Spencer.


Cook’s 97% Scam Debunked

by P. Homewood, October 29, 2020 in NotaLotofPeopleKonwThat


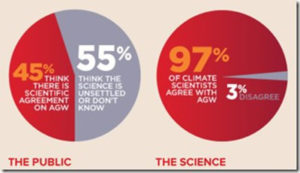
Yesterday, we saw how easily debunked the original “97% of scientists agree” turned out to be.

There therefore had to be a renewed attempt by the warmist establishment to make the claim stick, so step forward John Cook with a much more sophisticated scam.

Jose Duarte, expert in Social Psychology, Scientific Validity, and Research Methods, has actually called the Cook paper “multiply fraudulent”, and, as far as I know, Cook has taken no action to challenge the claim. This, as much as anything else, shows just what a con trick the whole business was. How many scientists, after all, would accept being called fraudulent without taking action?

See also

https://www.youtube.com/watch?

v=ZZrORkOGdYYhttps://www.youtube.com/watch?v=p1KoCMUYL20


WASHINGTON, D.C. JUST SUFFERED ITS COLDEST MAY SINCE 2005

by Cap Allon, June 2, 2020 in Electroverse


Like April, May was cooler than average across the District,” admits filthy warm-mongers the washingtonpost.com in a recent article. The month officially logged an average temperature of just 63.8F, which is 2.2F below the 30-year average, and made for Washington’s coldest May in 15 years.

The average temperature more closely matched a typical May in New York City, points out the Southeast Regional Climate Center. And with NYC located some 200 miles north of Washington, May 2020 serves as a great illustration of how the GSM is driving the COLD LINE south.

The past two months also marked the first time since 2003 that both April and May were colder than average across the District.

In addition, May 9’s daily high of 52F was the lowest-high during the month of May since May 12, 2008 (solar minimum of cycle 23), and the chill even brought a few snow flurries to Washington’s far north and west suburbs. That 52F on May 9 also matched the record lowest-high for the date which was set way back in 1877 (solar minimum of cycle 11).

Many more all-time cold-records fell across the District that day; including Dulles smashing its record for min-high from 1977 (solar minimum of cycle 20), and Baltimore toppling both its all-time min-low from 1966 (solar minimum of cycle 19) as well as its min-high set back in 1977 (solar min of cycle 20)and 1947 (solar min of cycle 17).

Renewable energy development threatens many globally important biodiversity areas

by Rehbein J.A. et al., March 2020, in GlobalChangeBiology


Transitioning from fossil fuels to renewable energy is fundamental for halting anthropogenic climate change. However, renewable energy facilities can be land‐use intensive and impact conservation areas, and little attention has been given to whether the aggregated effect of energy transitions poses a substantial threat to global biodiversity. Here, we assess the extent of current and likely future renewable energy infrastructure associated with onshore wind, hydropower and solar photovoltaic generation, within three important conservation areas: protected areas, Key Biodiversity Areas and Earth’s remaining wilderness. We identified 2,206 fully operational renewable energy facilities within the boundaries of these conservation areas, with another 922 facilities under development. Combined, these facilities span and are degrading 886 protected areas, 749 Key Biodiversity Areas, and 40 distinct wilderness areas. Two trends are particularly concerning. First, while the majority of historical overlap occurs in Western Europe, the renewable electricity facilities under development increasingly overlap with conservation areas in South East Asia, a globally important region for biodiversity. Second, this next wave of renewable energy infrastructure represents a ~30% increase in the number of protected areas and Key Biodiversity Areas impacted and could increase the number of compromised wilderness areas by ~60%. If the world continues to rapidly transition towards renewable energy these areas will face increasing pressure to allow infrastructure expansion. Coordinated planning of renewable energy expansion and biodiversity conservation is essential to avoid conflicts that compromise their r​e​s​p​e​c​t​

Fantasy Wish List Masquerades as Climate Poll

by Donna Laframboise, June1, 2020 in BigPicturesNews


Green lobby group invites public to endorse green fantasies.

Last week, a raft of newspaper headlines declared “Canadians still support climate action: poll.” We are intended to believe that “COVID-19’s economic and health challenges haven’t diminished” ordinary people’s enthusiasm for green policies. But this poll has oodles of problems.

First, it was sponsored by Clean Energy Canada. Embedded within the term clean energy is the philosophical argument/political statement/moral judgment that our current, dominant forms of fossil fuel-based energy are dirty.

A ‘clean energy’ outfit isn’t neutral. Its entire purpose is to promote some ideas and to disparage others. What actually happened here is an organization with an agenda drew up a fantastical wish list, and then invited Canadians to agree that the items on that wish list are awesome.

Big surprise that lots of people think upgrading broadband Internet service and public transit are a good idea – especially when the pollster, Abacus Data, declares them “part of an effort to attract companies to invest and grow businesses in Canada.”

Big surprise that lots of people like the idea of “Creating more spaces in towns and cities where people can walk and cycle without fear of vehicles.” But the realistic questions, surely, are:

Destroying the environment to save it

by Ch. Rotter, May 31, 2020 in WUWT


Pseudo-green energy will wreak devastation, pretending to prevent exaggerated climate harm

Paul Driessen

“We had to destroy the village in order to save it.” The infamous Vietnam era quotation may or may not have been uttered by an anonymous US Army major. It may have been misquoted, revised, apocryphal or invented. But it quickly morphed into an anti-war mantra that reflected attitudes of the time.

For Virginians and others forced to travel the path of “clean, green, renewable, sustainable” energy, it will redound in modern politics as “We had to destroy the environment in order to save it.”

Weeks after Governor Ralph Northam signed Virginia’s “Clean Economy Act,” which had been rushed through a partisan Democrat legislature, Dominion Energy Virginia announced it would reach “net zero” greenhouse gas emissions by 2050. To do so, the utility company will raise family, business, hospital and school electricity bills by 3% every year for the next ten years – as these customers and state and local governments struggle to climb out of the financial holes created by the ongoing Coronavirus lockdown.

Just as bad, renewable energy mandates and commitments from the new law and Dominion’s “integrated resource plan” will have major adverse impacts on Virginia and world environmental values. In reality, Virginia’s new “clean” economy exists only in fantasy land – and only if we ignore “clean” energy CO2 emissions, air and water pollution, and other environmental degradation around the world.

Dominion Energy plans to expand the state’s offshore wind, onshore solar and battery storage capacity by some 24,000 megawatts of new “renewable” energy by 2035, and far more after that. It will retain just 9,700 MW of existing natural gas generation, and only through 2045, build no new gas-fired units, and retire 6,200 megawatts of coal-fired generation. This will reduce in-state carbon dioxide emissions, but certainly won’t do so globally. The company intends to keep its four existing nuclear units operating.

To “replace” some of its abundant, reliable, affordable fossil fuel electricity, Dominion intends to build at least 31,400 megawatts of expensive, unreliable solar capacity by 2045. The company estimates that will require a land area some 25% larger than 250,000-acre Fairfax County, west of Washington, DC. That means Dominion Energy’s new solar facilities will blanket 490 square miles (313,000 acres) of beautiful croplands, scenic areas and habitats that now teem with wildlife.

The Paris Accord now looks like a suicide note from Western democracies

by Craig Kelly, June1, 2020 in SpectatorAustralia


Number nine in Craig Kelly’s series 20 reasons why the Wuhan Flu is the final nail in the climate alarmists’ coffin.

It is now four and a half years since the euphoria of the Paris Climate Accord. At the time, United States President Obama hailed it as “a turning point for the world.” The then UN Secretary-General Ban Ki-moon labelled it “a monumental success for the planet and its people.” 

And such was the exhilaration and excitement amongst the fourth estate after the Conference, my jesting comments (in an attempt to highlight the absurdity of the whole thing) were taken and reported seriously: “At home in Australia, there were more Kumbaya statements from local politicians. Leading the charge, Liberal MP Craig Kelly, seemingly overwhelmed with joy exclaimed ‘Hallelujah. The world is saved … The polar bears can sleep soundly tonight’.”

However, with the passage of the time and as the euphoria has died down, the world has had a chance to consider the devil in the detail. For under the Paris Climate Accord, Western nations have agreed to punish their economies, limit their growth, and incur tens of billions in unnecessary costs – all in the belief that this will somehow reduce the incidents of bad weather. 

While in contrast under Paris, the Chinese Communist Party has agreed to: “Achieve the peaking of carbon dioxide emissions around 2030 and making best efforts to peak early ….. to create a prosperous, strong, democratic, culturally developed and harmonious modern socialist country by the middle of this century.”