
by K. Richard, Sep 21, 2020 in NoTricksZone
Paleoclimate reconstructions that find no unusual modern warming are nonetheless characterized as showing sharp temperature increases in recent decades anyway.
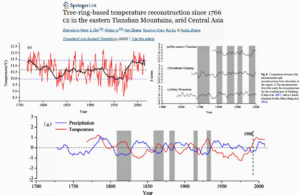
A new (Li et al., 2020) 1818-2012 temperature reconstruction determined 1955 (6.33 °C) and 2001 (7.17 °C) were the 1st and 5th coldest years in northeastern China in the last 200 years. The two warmest years were 1832 (9.63 °C) and 1900 (9.57 °C).
Further, the highest “continuous high decadal temperatures” recorded were in 1818–1844 and 1856–1873. The post-1950s temperatures were colder than nearly all of the first 100 years of the temperature record.
And yet in spite of the warmer 19th-century temperatures, the authors chracterize the slight temperature rise since the 1950s as heralding in “unprecedented” warming. They make this claim (of “unprecedented” recent warmth) in both the paper’s textual and graphical abstracts.
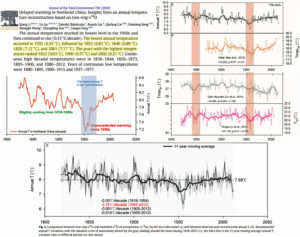
Image Source: Li et al., 2020
Forbes et al. (2020) use thermometer data from an Alaskan airport for the last ~90 years of their temperature record. The instrumentals show surface temperatures cooled -0.7°C in winter (January) and warmed 0.8°C in summer (July) from the 1950s-’80s decades to the 1990s to 2010s.
For the summer temperature record (shown in red below), nearly all the warming occurred during a step-change from the mid-1970s to mid-1980s. Since about 1985, summer temperatures seem to have been stable to slightly declining.
A lack of net overall warming in the last 50 or 60 years does not advance the anthropogenic global warming (AGW) cause, of course.
…


