Full-time professor at the Free University of Brussels, Belgium
apreat@gmail.com
apreat@ulb.ac.be
• Department of Earth Sciences and Environment
Res. Grp. - Biogeochemistry & Modeling of the Earth System
Sedimentology & Basin Analysis
• Alumnus, Collège des Alumni, Académie Royale de Sciences, des Lettres et des Beaux Arts de Belgique (mars 2013). http://www.academieroyale.be/cgi?usr=2a8crwkksq&lg=fr&pag=858&rec=0&frm=0&par=aybabtu&id=4471&flux=8365323
• Prof. Invited, Université de Mons-Hainaut (2010-present-day)
• Prof. Coordinator and invited to the Royal Academy of Sciences of Belgium (Belgian College) (2009-
present day)
• Prof. partim to the DEA (third cycle) led by the University of Lille (9 universities from 1999 to 2004) - Prof. partim at the University of Paris-Sud/Orsay, European-Socrates Agreement (1995-1998)
• Prof. partim at the University of Louvain, Convention ULB-UCL (1993-2000)
• Since 2015 : Member of Comité éditorial de la Revue Géologie de la France http://geolfrance.brgm.fr
• Since 2014 : Regular author of texts for ‘la Revue Science et Pseudosciences’ http://www.pseudo-sciences.org/
• Many field works (several weeks to 2 months) (Meso- and Paleozoic carbonates, Paleo- to Neoproterozoic carbonates) in Europe, USA (Nevada), Papouasia (Holocene), North Africa (Algeria, Morrocco, Tunisia), West Africa (Gabon, DRC, Congo-Brazzaville, South Africa, Angola), Iraq... Recently : field works (3 to 5 weeks) Congo- Brazzaville 2012, 2015, 2016 (carbonate Neoproterozoic).
Degree in geological sciences at the Free University of Brussels (ULB) in 1974, I went to Algeria for two years teaching mining geology at the University of Constantine. Back in Belgium I worked for two years as an expert for the EEC (European Commission), first on the prospecting of Pb and Zn in carbonate environments, then the uranium exploration in Belgium. Then Assistant at ULB, Department of Geology I got the degree of Doctor of Sciences (Geology) in 1985. My thesis, devoted to the study of the Devonian carbonate sedimentology of northern France and southern Belgium, comprised a significant portion of field work whose interpretation and synthesis conducted to the establishment of model of carbonate platforms and ramps with reefal constructions.
I then worked for Petrofina SA and shared a little more than two years in Angola as Director of the Research Laboratory of this oil company. The lab included 22 people (micropaleontology, sedimentology, petrophysics). My main activity was to interpret facies reservoirs from drillings in the Cretaceous, sometimes in the Tertiary. I carried out many studies for oil companies operating in this country.
I returned to the ULB in 1988 as First Assistant and was appointed Professor in 1990. I carried out various missions for mining companies in Belgium and oil companies abroad and continued research, particularly through projects of the Scientific Research National Funds (FNRS).
My research still concerns sedimentology, geochemistry and diagenesis of carbonate rocks which leads me to travel many countries in Europe or outside Europe, North Africa, Papua New Guinea and the USA, to conduct field missions.
Since the late 90's, I expanded my field of research in addressing the problem of mass extinctions of organisms from the Upper Devonian series across Euramerica (from North America to Poland) and I also specialized in microbiological and geochemical analyses of ancient carbonate series developing a sustained collaboration with biologists of my university. We are at the origin of a paleoecological model based on the presence of iron-bacterial microfossils, which led me to travel many countries in Europe and North Africa. This model accounts for the red pigmentation of many marble and ornamental stones used in the world. This research also has implications on the emergence of Life from the earliest stages of formation of Earth, as well as in the field of exobiology or extraterrestrial life ...
More recently I invested in the study from the Precambrian series of Gabon and Congo. These works with colleagues from BRGM (Orléans) are as much about the academic side (consequences of the appearance of oxygen in the Paleoproterozoic and study of Neoproterozoic glaciations) that the potential applications in reservoir rocks and source rocks of oil (in collaboration with oil companies).
Finally I recently established a close collaboration with the Royal Institute of Natural Sciences of Belgium to study the susceptibility magnetic signal from various European Paleozoic series. All these works allowed me to gain a thorough understanding of carbonate rocks (petrology, micropaleontology, geobiology, geochemistry, sequence stratigraphy, diagenesis) as well in Precambrian (2.2 Ga and 0.6 Ga), Paleozoic (from Silurian to Carboniferous) and Mesozoic (Jurassic and Cretaceous) rocks. Recently (2010) I have established a collaboration with Iraqi Kurdistan as part of a government program to boost scientific research in this country.
My research led me to publish about 180 papers in international and national journals and presented more than 170 conference papers. I am a holder of eight courses at the ULB (5 mandatory and 3 optional), excursions and field stages, I taught at the third cycle in several French universities and led or co-managed a score of 20 Doctoral (PhD) and Post-doctoral theses and has been the promotor of more than 50 Masters theses.
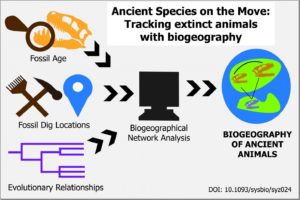
One researcher at the University of Tokyo is in hot pursuit of dinosaurs, tracking extinct species around ancient Earth. Identifying the movements of extinct species from millions of years ago can provide insights into ancient migration routes, interaction between species, and the movement of continents.
“If we find fossils on different continents from closely related species, then we can guess that at some point there must have been a connection between those continents,” said Tai Kubo, Ph.D., a postdoctoral researcher affiliated with the University Museum at the University of Tokyo.
A map of life – biogeography
Previous studies in biogeography — the geographic distribution of plants and animals — had not considered the evolutionary relationships between ancient species. The new method that Kubo designed, called biogeographical network analysis, converts evolutionary relationships into geographical relationships.
…
By combining data from fossils and models of the ancient Earth, researchers can map where ancient species may have migrated. This method, called biogeographical network analysis, converts evolutionary relationships between species into geographical relationships. This method was used in research by Tai Kubo, Ph.D., a postdoctoral researcher affiliated with the University Museum at the University of Tokyo. Credit Caitlin Devor, The University of Tokyo, CC-BY Usage Restrictions Image by Caitlin Devor, The University of Tokyo, CC-BY
Total greenhouse gas emissions in the European Union (EU) increased by 0.7 % in 2017, according to latest official data published today by the European Environment Agency (EEA). Less coal was used to produce heat and electricity but this was offset by higher industrial and transport emissions, the latter increasing for the fourth consecutive year.
According to the EEA’s Annual European Union greenhouse gas inventory 1990-2017 and inventory report 2019, total greenhouse gas emissions (including international aviation) rose by 0.7 % in 2017 compared with 2016. These official data confirm the preliminary estimates published by the EEA in October 2018. From 1990 to 2017, the EU reduced its net greenhouse gas emissions by 21.7 %. The EU is therefore still exceeding its 20 % reduction target set for 2020.
The globally averaged temperature rose 1.5°F from 1880 to today. Various narratives suggest the rise since 1950 was driven by increasing concentrations of CO2. The rising temperature before 1950 was considered natural. Since 1990, Arctic temperatures rose 2 to 3 times faster than the global average. So, are rapidly rising Arctic temperatures evidence of an impending climate crisis?
Astute students of climate history recall rapid Arctic warming has happened often and naturally. During the last Ice Age when CO2 concentrations were just half of today’s, 25 abrupt warming events happened. Arctic temperatures rose 9°F, and sometimes as much as 14°F in just 40 years. These rapid warming episodes are now called Dansgaard–Oeschger events (D-O events) in honor of the researchers who first detected them in Greenland’s ice cores. These D-O episodes affected global climate, changed ocean currents along California’s coast and altered the range of European forests.
What caused such abrupt warming? Basic physics dismisses changes in greenhouse gases or solar insolation because neither radiative effect induces such rapid warming. The most reasonable explanation suggests episodes of ventilating heat, that had accumulated in the Arctic Ocean, rapidly warmed the air.
by P. Homewood, May 29, 2019 in NotaLotofPeopleKnowThat
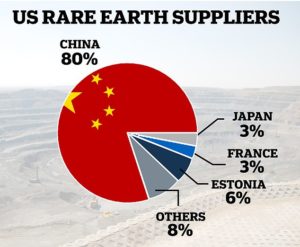
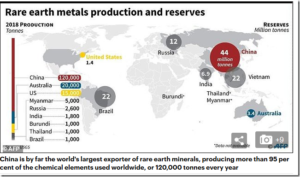
China has hinted that a trade war with the U.S. could lead to real war with a coded warning as it threatens to stop exporting essential ‘rare earth’ minerals.
A commentary in People’s Daily, the mouthpiece of China‘s ruling Communist Party, today said ‘Don’t say we didn’t warn you!’ – which is a diplomatic term usually reserved by Beijing to signal the start of an armed warfare.
China yesterday said it is ‘seriously considering’ restricting exports to the United States of rare earths, 17 chemical elements used in hospital scanners, nuclear power stations and LED lights.
China accounted for 80 per cent of rare earth imports between 2014 and 2017 to the United States.
With the devastating Dayton, Ohio tornadoes fresh on our minds, it is useful to examine exactly why (modest) global warming has produced fewer – not more – of such events.
The simple answer is that tornado formation requires unusually cool air.
Very few thunderstorms produce tornadoes. In the hot and humid tropics, they are virtually unheard of. The reason why is that (unlike hurricanes) tornadoes require strong wind shear, which means wind speed increasing and changing direction with height in the lower atmosphere.
These conditions exist only when a cool air mass collides with a warm air mass. And the perfect conditions for this have existed this year as winter has refused to lose its grip on the western United States. So far for the month of May 2019, the average temperature across the U.S. is close to 2 degrees Fahrenheit below normal.
by Eva Gomez, 28 mai 2018 in EnvironnementMagazine
Ce mardi 28 mai, le bureau d’études Enerdata publie son bilan énergétique mondial pour l’année 2018. Celui-ci fait part d’une hausse et de nouveaux records de consommation d’énergie et d’émissions de CO2.
En 2018, les pays du G20 ont vu leur consommation d’énergie augmenter de 2,1% et leurs émissions de CO21 de 1,7%, conclut Enerdata ce mardi 28 mai. Dans son nouveau bilan énergétique mondial, le bureau d’étude souligne que la croissance économique reste stable (+3,8%) dans les pays du G20, qui affichent néanmoins un niveau record de consommation énergétique. Dans l’Union européenne, les consommations d’énergie ont un peu diminué, mais cette baisse est compensée par une hausse de celles des Etats-Unis et des pays non membres de l’OCDE. « La consommation énergétique des USA a fortement augmenté, ce qui peut s’expliquer par les conditions climatiques extrêmes auxquelles ils ont été soumis, dont l’hiver très froid qui a demandé beaucoup de chauffage », explique le président d’Enerdata, Pascal Charriau. Par ailleurs, il semblerait que « le développement économique se fasse de façon énergivore : même si on observe un léger gain d’intensité énergétique, l’efficacité énergétique n’est pas améliorée », souligne-t-il.
by Usbek, 29 mai 2019 in ClimatEnvironnementEnergie
Le 22 mai 2019 la Chambre des représentants des Etats Unis a organisé une audition sur le récent rapport d’évaluationglobale de l’IPBES (Plateforme intergouvernementale scientifique et politique sur la biodiversité et les services éco systémiques ).
Patrick Moore a été invité a donner son témoignage; nous en donnons ci-dessous une traduction (les liens et renvois en bas de page sont du traducteur).
Je vous remercie de m’avoir donné l’occasion de témoigner à l’audience d’aujourd’hui.
En 1971, alors que j’étais doctorant en écologie, je me suis joint à un groupe d’activistes dans un sous-sol d’église à Vancouver, au Canada, et j’ai traversé le Pacifique à bord d’un petit bateau pour protester contre les essais américains de bombes à hydrogène en Alaska. Nous sommes devenus Greenpeace. Après 15 ans au sein du comité directeur, j’ai dû quitter Greenpeace, qui commençait à adopter des politiques que je ne pouvais accepter d’un point de vue scientifique.
Je me suis donné comme mission de toujours appliquer de sains principes scientifiques lors de l’examen des problèmes environnementaux critiques auxquels nous sommes confrontés aujourd’hui.
Ce n’est qu’au début des années 1900, marquées par la disparition définitive de la tourte voyageuse en 1914, que le grand public a commencé à s’intéresser de près à la question de l’extinction des espèces. Cette prise de conscience a été inspirée par l’activisme précoce de Théodore Roosevelt, John Muir et Gifford Pinchot.
by P. Homewood, May 28, 2019 in NotaLotofPeopleKnowThat
You would think the Washington Post should be able to distinguish between a handful of protesting school kids and millions of grown up voters!
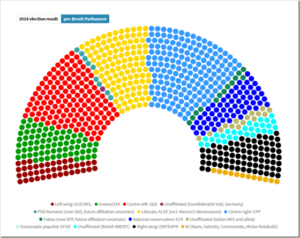
In recent months, massive demonstrations over climate change have rocked European capitals, dwarfing the mobilizations of the continent’s far right. Fridays for Future — a movement inspired by Swedish teenage activist Greta Thunberg — has seen countless European teenagers walk out of school to protest climate inaction. It underscores a growing consensus among the next generation of voters that governments must do more to mitigate environmental disaster, and an impatience with political parties that refuse to recognize the urgency of the situation.
Climate change, said an editorial in France’s Liberation newspaper, “has become the principal criteria of judging political action in the European Union.”
There are two key pillars of science. First, it doesn’t matter how many “scientists” believe something. All of them could be proven wrong by a single new scientific theory or experiment. Science is always tentatively proven, and it is incumbent on everyone who calls himself a scientist to ask questions even about things that are “settled”. The great physicist Richard Feynman rightly said, “Science is the belief in the ignorance of experts”. Scientists must continually question everything and everybody.
Second, science must necessarily make accurate predictions. The global positioning system (GPS) in our mobile phones works only because Einstein’s theories of relativity are accurate to the last possible decimal. Science must not just predict the future: it must predict backwards. Our scientific understanding of cosmic microwave background radiation allows us to literally see the universe as it existed a few thousand years after the Big Bang.
With climate change, things are dramatically unclear and unsettled. Even converting the basic logic of the greenhouse effect into actual estimates for planet Earth is not settled. The IPCC’s Third Assessment Report notes that "If the amount of carbon dioxide were doubled instantaneously … the temperature of the surface-troposphere system would have to increase by 1.2 degrees, in the absence of other changes”. However, some scientists calculate that its impact would be much lower.
by P. Homewood, May 26, 2019 in NotaLotofPeopleKnowThat
Taxpayers’ money earmarked to support overseas development has been spent on supporting China’s fracking industry, The Independent can reveal.
The government is required to spend 0.7 per cent of its national income each year on foreign aid.
But even with climate change threatening the developing world with droughts, flooding and heatwaves, millions have been spent on fossil fuel investment abroad over the past two years.
This includes two schemes aiming to “export the UK’s expertise in shale gas regulation” to China, as controversy about new drilling sites rages back in Britain.
I won’t bore you with the rest of the story. As you can probably guess, the “Independent” being the “Independent” proceeds to give full coverage to a load of eco cranks, including Christian Aid, who claim that the rapidly changing climate is driving more extreme weather, more acute disasters. (Don’t they know it’s a sin to lie?)
At the end they deign to give a few words to the government spokesperson.
Leaving aside the question why China needs our aid at all, the “Independent” fails to ask the really relevant question of why our government is so keen for us to decarbonise at huge cost, but at the same time thinks it is a good idea to help China develop their natural gas sector?
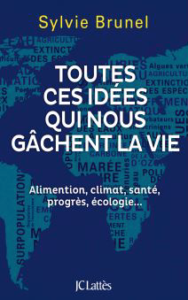
Nous sommes manifestement dans une période médiatico-politique rarement rencontrée dans notre histoire, excepté peut-être aux passages des millénaires et des siècles où les peurs tous azimuts ont engendré chaque fois des comportements irrationnels. Pourtant aujourd’hui nous sommes de plain pied dans un siècle, il n’y a aucune date revêtant une signification particulière et il est presque question de la fin du monde tous les jours puisque le slogan à la mode est ‘la fin du mois ou la fin du monde’. Slogan répété à l’envi par tant de jeunes, de ‘défavorisés’, de retraités et repris en cœur dans les médias et aussi par des scientifiques.
Alors tout ceci est-il fondé ? Faut-il avoir sans cesse peur, peur principalement alimentée par la peur climatique, mais pas uniquement…
(German text translated/edited by P Gosselin)
Was it sloppiness or intent? In the IPCC Summary Report for Policymakers published by the Federal Government in German, the most important statement of the original English report was falsified.
IPCC reports are available as comprehensive status reports and get strongly condensed as reports for policymakers. The latter are not to be taken as IPCC-authorized extracts as the governments concerned are allowed contribute in the writing. As a result, information or formulations from the English IPCC original which do not agree with German politics are often omitted in the German IPCC reports for policymakers. This is popularly called censorship. As a result of such falsifications, the status reports and the corresponding reports for policymakers are often contradiction.
Key finding deleted from Summary for Policymakers
One example in the past was the famous Chapter 2.6 of the AR5 Report, in which the IPCC explained in detail that no increase in extreme weather events could be found in climate periods (about 30 years) from 1950 onwards (beginning of more extensive measurements and statistics). EIKE reported on this. But in the accompanying German IPCC report for policymakers, this IPCC finding, which is hardly trivial, was nowhere to be seen.
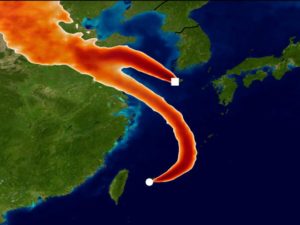
Scientists found that between 40 and 60 per cent of the total global CFC-11 emissions originated from eastern China
A chemical banned around the globe for the last 30 years has made an unfortunate resurgence. And all signs, in a new study, point to China as the culprit.
In this graphic, monitoring stations in Japan and Korea designed to track unwanted emissions in the atmosphere attempt to pinpoint the origin of an increase in CFC-11 emissions. Tracking the gas’ presence and weather conditions, scientists concluded it originated from eastern mainland China. A new study published May 22, 2019, found that 40 to 60 per cent of global CFC-11 emissions originated from the region. UNIVERSITY OF BRISTOL
New Delhi: Fitch Solutions Tuesday said India’s thermal coal output is projected to grow at an average annual rate of 4.3 per cent by 2028. “In absolute volume terms, China and India will have the largest impact on the global coal market balance,” Fitch Solutions Macro Research said in a report.
It further said the surge in Chinese imports that occurred over 2015-2017 as a result of dramatic domestic production curbs was a temporary phenomenon.
“We forecast thermal coal production in China to stagnate at 0.5 per cent growth per annum from 2019 onwards, but not decline, as new coal mines in Inner Mongolia, Shaanxi and Shanxi provinces offset mine closures in the rest of the country,” it said.
Climate change was supposed to have won the party the Australian election. But yesterday, routed in the polls, panicking Labor Party leaders backed the opening of a coal field bigger than the UK to mining.
Fearing a wipeout in state elections next year amid a rising tide of pro-coal workers and a rebellion against its plans to halve Australia’s carbon emissions, the Labor state government in Queensland accelerated its decision on 105,000 square miles of coal-rich outback land known as the Galilee Basin.
It came days after the party lost what was dubbed as the “climate election” to the incumbent centre-right, pro-coal government of Scott Morrison, suffering the most damage with swings of up to 20 per cent in the coal country of central Queensland and the Hunter Valley of New South Wales.
Queensland’s premier, Annastacia Palaszczuk, announced she was overturning all attempts to block mining and all outstanding approvals would be resolved within three weeks. She said she was “fed up” with her own government’s processes, and that the election had been a “wake-up call” on mining the basin. The move was welcomed by the federal resources minister, Matt Canavan, who told The Times yesterday that the Galilee Basin represented a victory for the “hi-vis workers’ revolution” — a reference to the armies of mine workers, dressed in high-visibility shirts, who make Australia the world’s biggest coal exporter, and seemingly a reference to the “yellow vest” movement in France which battled President Macron on his climate policies.
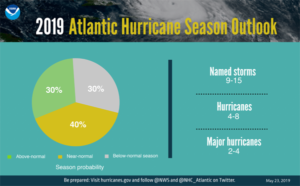
El Nino and warmer-than-average Atlantic help shape this season’s intensity
From NOAA press release:
NOAA’s Climate Prediction Center is predicting that a near-normal Atlantic hurricane season is most likely this year. This outlook forecasts a 40% chance of a near-normal season, a 30% chance of an above-normal season and a 30% chance of a below-normal season. The hurricane season officially extends from June 1 to November 30.
For 2019, NOAA predicts a likely range of 9 to 15 named storms (winds of 39 mph or higher), of which 4 to 8 could become hurricanes (winds of 74 mph or higher), including 2 to 4 major hurricanes (category 3, 4 or 5; with winds of 111 mph or higher). NOAA provides these ranges with a 70% confidence. An average hurricane season produces 12 named storms, of which 6 become hurricanes, including 3 major hurricanes.
Biomarker evidence for Arctic-region sea ice coverage in the northern Barents Sea indicates the most extensive sea ice conditions of the last 9,500 years occurred during the 20th century (0 cal yr BP). In contrast, this region was ice free with open water conditions during the Early Holocene (9,500-5,800 years ago).
A leading climatologist has said that the computer simulations that are used to predict global warming are failing on a key measure of the climate today and cannot be trusted.
Speaking to a meeting in the Palace of Westminster in London, Professor John Christy of the University of Alabama in Huntsville told MPs and peers that almost all climate models have predicted rapid warming at high altitudes in the tropics:
…
A paper outlining Dr. Christy’s key findings is published today by the Global Warming Policy Foundation.
Production from world uranium mines now supplies 90% of the requirements of power utilities.
Primary production from mines is supplemented by secondary supplies, formerly most from ex-military material but now the products of recycling and stockpiles built up in times of reduced demand.
World mine production has expanded significantly since about 2005.
All mineral commodity markets tend to be cyclical, i.e. prices rise and fall substantially over the years, but with these fluctuations superimposed on long-term trend decline in real prices, as technological progress reduces production cost at mines. In the uranium market, however, high prices in the late 1970s gave way to depressed prices in the whole of the period of the 1980s and 1990s, with spot prices below the cost of production for all but the lowest cost mines. Spot prices recovered from 2003 to 2009, but have been weak since then.
The quoted spot prices through to about 2007 applied only to day-to-day marginal trading and represented a small portion of supply, though since 2008 the proportion has approximately doubled, to about one-quarter in the last decade. Most trade is via 3-15 year term contracts with producers selling directly to utilities at a significantly higher price than the spot market, reflecting the security of supply.* The specified price in these contracts is, however, often related to the spot price at the time of delivery. However, as production has risen much faster than demand, fewer long-term contracts are being written.
The House Natural Resources Committee Subcommittee on Water, Oceans and Wildlife is holding a Hearing today on Responding to the Global Assessment Report of the Intergovernmental Science-Policy Platform on Biodiversity and Ecosystem Services.
Based on my previous experience with this Committee, the written testimonies will not be posted, and the Hearing will live stream on their Facebook page [link]
Here is the list of witnesses:
Sir Robert Watson, Immediate PastChair IPBES
Dr. Eduardo S. Brondizio, Co-Chair IPBES Global Assessment
Dr. Yunne Shin, Coordinating Lead Author, IPBES Global Assessment
Dr. Patrick Moore, Chairman CO2 Coalition [link to written testimony Moore]
Mr. Marc Morano, Founder Climate Depot [link to written testimony Morano]
Dr. Jacob Malcolm, Director Center for Conservation Innovation, Defenders of Wildlife
Quite an interesting list. Clearly some of the leading honchos for the IPBES Report. Surprised that the Republicans apparently got to pick several witnesses.
Having Marc Morano on this list is like waving a red cape before a bull. True to form, Marc has prepared an extremely hard hitting report for his written testimony, which was sent to me (and others) via email. Excerpts from Morano’s testimony are provided below:
Last week, Marc Chaussidon, director of the Institute of Geophysics in Paris (IPGP), looked at seafloor maps from a recently concluded mission and saw a new mountain. Rising from the Indian Ocean floor between Africa and Madagascar was a giant edifice 800 meters high and 5 kilometers across. In previous maps, there had been nothing. “This thing was built from zero in 6 months!” Chaussidon says.
His team, along with scientists from the French national research agency CNRS and other institutes, had witnessed the birth of a mysterious submarine volcano, the largest such underwater event ever witnessed. “We have never seen anything like this,” says IPGP’s Nathalie Feuillet, leader of an expedition to the site by the research vessel Marion Dufresne, which released its initial results last week.
The quarter-million people living on the French island of Mayotte in the Comoros archipelago knew for months that something was happening. From the middle of last year they felt small earthquakes almost daily, says Laure Fallou, a sociologist with the European-Mediterranean Seismological Centre in Bruyères-le-Châtel, France. People “needed information,” she says. “They were getting very stressed, and were losing sleep.”
by P. Homewood, May 22, 2019 in NotaLotofPeopleKnowThat
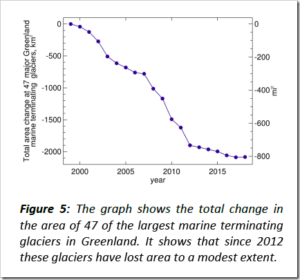
European satellites have detailed the abrupt change in behaviour of one of Greenland’s most important glaciers.
In the 2000s, Jakobshavn Isbrae was the fastest flowing ice stream on the island, travelling at 17km a year.
As it sped to the ocean, its front end also retreated and thinned, dropping in height by as much as 20m year.
But now it’s all change. Jakobshavn is travelling much more slowly, and its trunk has even begun to thicken and lengthen.
“It’s a complete reversal in behaviour and it wasn’t predicted,” said Dr Anna Hogg from Leeds University and the UK Centre for Polar Observation and Modelling (CPOM).
“The question now is: what’s next for Jakobshavn? Is this just a pause, or is it a switch-off of the dynamic thinning we’ve seen previously?”
The rapid flow, thinning and retreat of Jakobshavn’s front end in the mid to late 2000s were probably driven by warm ocean water from Disko Bay getting into the fjord and attacking the glacier from below.
The phase change, scientists think, may be related to very cold weather in 2013. This would have resulted in less meltwater coming off the glacier, which in turn might have choked the mechanism that pulls warm ocean water towards Jakobshavn.
When a journalist thinks for herself about climate change, insults and fabrications follow.
Two days ago I reported that a Washington, DC organization called the Government Accountability Project is smearing me on its website. I explained that PR firms target non-conformist climate reporting in an attempt to police what journalists say.
This story begins with a September 2013 opinion piece written by me and published in the Wall Street Journal. It concerned the Intergovernmental Panel on Climate Change (IPCC), and was headlined:
Within hours, a Rockefeller Foundation funded entity called Climate Nexus released an error-riddled 600-word rebuttal that now resides on the Government Accountability Project’s official-looking website. An organization with ‘accountability’ in its name is smearing me by reprinting material whose actual author remains in the shadows, anonymous to this day.
Line by line, over the course of two blog posts, I will now respond to this collection of factual errors and lazy insults. Let us begin with the first sentence:
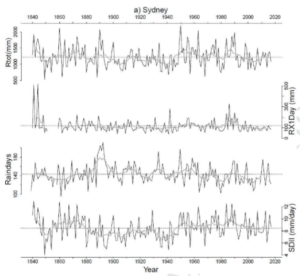
A new study appearing in the Journal of Weather and Climate Extremes titled “Historical extreme rainfall events in southeastern Australia” – led by LindenAshcroft, School of Earth Sciences, University of Melbourne – shows that even more extreme weather in terms of rainfall existed before 1900 in Melbourne, Sydney and Adelaide.
No real trend when examining Sydney, Australia data going back 178 years. Image: Ashcroft et al 2019.
Moreover, the authors found a “moderate and relatively stable relationship between El Niño–Southern Oscillation (ENSO) and annual variations of total rainfall and the number of raindays.”
In the context of the European elections, European Scientist is bringing you an series of views from experts from different countries on various topics around science and science policy in Europe, to provide an overview and analysis, which will be useful for the next commission.
ES: What is your assessment of energy policy in Europe? What have the major achievements of the outgoing commission been?
The greatest success of the outgoing commission is to have developed a policy to support gas interconnections by financing projects of common interest. The aim is that every single methane molecule that enters the territory of the Union can circulate to any other location. This will help to diversify gas supply sources, particularly from the south of the Union (thanks to more gas arriving as LNG and via the Southern Corridor).
ES: There is a wide disparity in energy policy between different countries (e.g. France and Germany). Do you think it is necessary to harmonise policy or on the contrary is it preferable to maintain diversity?
…
La géologie, une science plus que passionnante … et diverse