Archives de catégorie : climate-debate

Climatologist: Climate Models Are Predicting Too Much Warming

by Dr. Benny Peiser, May 23, 2019 in GWPF


A leading climatologist has said that the computer simulations that are used to predict global warming are failing on a key measure of the climate today and cannot be trusted.

Speaking to a meeting in the Palace of Westminster in London, Professor John Christy of the University of Alabama in Huntsville told MPs and peers that almost all climate models have predicted rapid warming at high altitudes in the tropics:

A paper outlining Dr. Christy’s key findings is published today by the Global Warming Policy Foundation.

Greenland Glaciers Growing Again

by P. Homewood, May 22, 2019 in NotaLotofPeopleKnowThat


European satellites have detailed the abrupt change in behaviour of one of Greenland’s most important glaciers.

In the 2000s, Jakobshavn Isbrae was the fastest flowing ice stream on the island, travelling at 17km a year.

As it sped to the ocean, its front end also retreated and thinned, dropping in height by as much as 20m year.

But now it’s all change. Jakobshavn is travelling much more slowly, and its trunk has even begun to thicken and lengthen.

“It’s a complete reversal in behaviour and it wasn’t predicted,” said Dr Anna Hogg from Leeds University and the UK Centre for Polar Observation and Modelling (CPOM).

“The question now is: what’s next for Jakobshavn? Is this just a pause, or is it a switch-off of the dynamic thinning we’ve seen previously?”

The rapid flow, thinning and retreat of Jakobshavn’s front end in the mid to late 2000s were probably driven by warm ocean water from Disko Bay getting into the fjord and attacking the glacier from below.

The phase change, scientists think, may be related to very cold weather in 2013. This would have resulted in less meltwater coming off the glacier, which in turn might have choked the mechanism that pulls warm ocean water towards Jakobshavn.

Refuting the Smear Machine – Part 1

by Donna Laframboise, Lay 22, 2019 in BigPictureNews


When a journalist thinks for herself about climate change, insults and fabrications follow.

Two days ago I reported that a Washington, DC organization called the Government Accountability Project is smearing me on its website. I explained that PR firms target non-conformist climate reporting in an attempt to police what journalists say.

This story begins with a September 2013 opinion piece written by me and published in the Wall Street Journal. It concerned the Intergovernmental Panel on Climate Change (IPCC), and was headlined:

Warming Up for Another Climate-Change Report
Every six years, a U.N. panel issues its findings, and the media hail them as definitive. Skepticism may be in order.

Within hours, a Rockefeller Foundation funded entity called Climate Nexus released an error-riddled 600-word rebuttal that now resides on the Government Accountability Project’s official-looking website. An organization with ‘accountability’ in its name is smearing me by reprinting material whose actual author remains in the shadows, anonymous to this day.

Line by line, over the course of two blog posts, I will now respond to this collection of factual errors and lazy insults. Let us begin with the first sentence:

Scientists Find No Human Impact On Extreme Rainfall Events In Southeastern Australia…Rather ENSO Related

by P. Gosselin, May 21, 2019 in NoTricksZone


A new study appearing in the Journal of Weather and Climate Extremes titled “Historical extreme rainfall events in southeastern Australia” – led by LindenAshcroft, School of Earth Sciences, University of Melbourne – shows that even more extreme weather in terms of rainfall existed before 1900 in Melbourne, Sydney and Adelaide.

No real trend when examining Sydney, Australia data going back 178 years. Image: Ashcroft et al 2019.

Moreover, the authors found a “moderate and relatively stable relationship between El Niño–Southern Oscillation (ENSO) and annual variations of total rainfall and the number of raindays.”

Interview with Samuele Furfari: European elections

by European Scientist, May 21, 2009


In the context of the European elections, European Scientist is bringing you an series of views from experts from different countries on various topics around science and science policy in Europe, to provide an overview and analysis, which will be useful for the next commission.


ES: What is your assessment of energy policy in Europe? What have the major achievements of the outgoing commission been?

The greatest success of the outgoing commission is to have developed a policy to support gas interconnections by financing projects of common interest. The aim is that every single methane molecule that enters the territory of the Union can circulate to any other location. This will help to diversify gas supply sources, particularly from the south of the Union (thanks to more gas arriving as LNG and via the Southern Corridor).


ES: There is a wide disparity in energy policy between different countries (e.g. France and Germany). Do you think it is necessary to harmonise policy or on the contrary is it preferable to maintain diversity?

Greenland Has Been Cooling In Recent Years – 26 Of Its 47 Largest Glaciers Now Stable Or Gaining Ice

by K. Richard, May 20, 2019 in NoTricksZone


A new analysis of recent trends for the Greenland ice sheet reveals that since 2012 there has been an abrupt slowing of melt rates and a trend reversal to cooling and ice growth.
• In 2018, 26 of Greenland’s 47 largest glaciers were either stable or grew in size.
• Overall, the 47 glaciers advanced by +4.1  km² during 2018.  Of the 6 largest glaciers, 4 grew while 2 retreated.
• Since 2012, ice loss has been “minor” to “modest” due to the dramatic melting slowdown.
• Summer average temperatures for 2018 were lower than the 2008-2018 average by more than one standard deviation.
• Since 2000, the extent of the non-snow-covered areas of Greenland has increased by 500 km² per year.

EDITORIAL: A CLIMATE-CHANGE DRUBBING IN AUSTRALIA

by GWPF from WallStreetJ, May 19, 2019


The right in Australia won on the sharp contrast with the left on taxes, growth and climate change.

If American Democrats want a warning about the consequences of embracing the Green New Deal, look no further than Saturday’s election shocker in Australia. The opposition center-left Labor Party had led in the polls for months but lost as voters rejected its move left on taxes, spending and above all on climate change.

The ruling Liberal-National Coalition had been divided and tossed out two prime ministers during its nearly six years in power. Scott Morrison, the compromise choice as Prime Minister last year, managed to unite conservatives around a platform that stressed economic growth, tax cuts and support for the country’s energy producers.

Labor leader Bill Shorten promised to raise taxes on the “wealthy,” but his main theme was curbing climate change. Labor promised to cut carbon emissions nearly in half by 2030 compared to 2005 levels while subsidizing wind and solar. Mr. Shorten and Labor refused to support a job-producing coal mine in Queensland, and their candidates were routed in the resource-rich province.

Bill Shorten, leader of the Labor Party of Australia, reacts as he concedes defeat during the Labor party election night event in Melbourne, Australia, on Saturday, May 18, 2019. PHOTO: CARLA GOTTGENS/BLOOMBERG NEWS

140 Years to a PETM-Style Doomsday!!! Another PETM/Chicken Little of the Sea Epic Fail

by David Middleton, May 18, 2019 in WUWT


Gingerich, 2019 is a recent paper reiterating the PETM Chicken Little of the Sea meme. In the comments section of a recent post, it was cited as evidence of imminent catastrophe and followed up by a comment featuring this image from Clean Tecnica:

I just had to track this back to the Clean Tecnica article… Their scientific prowess is almost always laughable… And I was not disappointed.

Our Urban “Climate Crisis”

by Jim Steele, May 17, 2019 in WUWT


Based on a globally averaged statistic, some scientists and several politicians claim we are facing a climate crisis. Although it’s wise to think globally, organisms are never affected by global averages. Never! Organisms only respond to local conditions. Always! Given that weather stations around the globe only record local conditions, it is important to understand over one third of the earth’s weather stations report a cooling trend (i.e. Fig 4 below ) Cooling trends have various local and regional causes, but clearly, areas with cooling trends are not facing a “warming climate crisis”. Unfortunately, by averaging cooling and warming trends, the local factors affecting varied trends have been obscured.

It is well known as human populations grow, landscapes lose increasing amounts of natural vegetation, experience a loss of soil moisture and are increasingly covered by heat absorbing pavement and structures. All those factors raise temperatures so that a city’s downtown area can be 10°F higher than nearby rural areas. Despite urban areas representing less than 3% of the USA’s land surface, 82% of our weather stations are located in urbanized areas. This prompts critical thinkers to ask, “have warmer urbanized landscapes biased the globally averaged temperature?” (Arctic warming also biases the global average, but that dynamic must await a future article.)

‘Gimme Gimme Shock Treatment’

by Joe Bastardi, May 17, 2019 inThePatriotPost


Apparently, the new strategy to fight climate change is shock therapy. It’s like today’s environmental crusaders are channeling the Ramones song “Gimme Gimme Shock Treatment.” Here are some illustrations.

Shock treatment is for extreme measures. But take, for example, this Dr. Willie Soon plot of solar irradiance (a measure of solar energy) vs. water vapor:

Water vapor is the number-one greenhouse gas. So it’s no secret what temperatures do when water vapor increases.

Recent Studies Indicate Species Extinctions Decline With Warming – Mass Extinction Events Due To COOLING

by K. Richard, May 16, 2019 in NoTricksZone


In the past it has been widely reported that high and abruptly changing CO2 concentrations led to climate conditions that were “too hot for complex life to survive” on the planet.
More recently, though, scientists have determined that the opposite may have been true: mass extinction events occurred during periods of global cooling, expansive ice sheet growth, and marine-habitat-destroying sea level drops of more than 100 meters.
In fact, of the 5 previous mass extinctions, volcanism-induced glaciation is thought to be responsible for the 1st, 3rd, and 4th events, with the 2nd unknown and the 5th from an aseteroid impact.  None of these explanations have ties to CO2 concentrations or sudden warming.

Image Sources: Loehle & Eschenbach (2012), BBC, Wrightstone, 2019

No Hockey Sticks: Studies Reveal Long-Term Lack of Warming

by Vijay Jayaraj, May 16,2019 in WUWT


A new temperature reconstruction, using proxy temperature measurements from locations in central Asia, has revealed that there has been no warming in the past 432 years.

The Global Warming “Hiatus” or Pause

The word “hiatus” became popular in recent years after the discovery of a pause or hiatus in global warming. There has been a lack of warming in the atmosphere since 1999, despite the predictions of computer climate models.

HALF OF 21ST CENTURY WARMING DUE TO EL NINO

by Roy Spencer, May 15, 2019 in GWPF


A major uncertainty in figuring out how much of recent warming has been human-caused is knowing how much nature has caused. The IPCC is quite sure that nature is responsible for less than half of the warming since the mid-1900s, but politicians, activists, and various green energy pundits go even further, behaving as if warming is 100% human-caused.

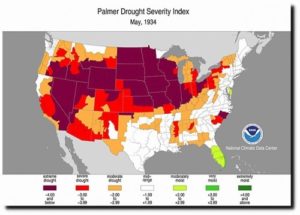
The fact is we really don’t understand the causes of natural climate change on the time scale of an individual lifetime, although theories abound. For example, there is plenty of evidence that the Little Ice Age was real, and so some of the warming over the last 150 years (especially prior to 1940) was natural — but how much?

The answer makes as huge difference to energy policy. If global warming is only 50% as large as is predicted by the IPCC (which would make it only 20% of the problem portrayed by the media and politicians), then the immense cost of renewable energy can be avoided until we have new cost-competitive energy technologies.

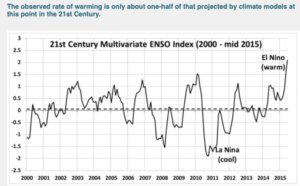
The recently published paper Recent Global Warming as Confirmed by AIRSused 15 years of infrared satellite data to obtain a rather strong global surface warming trend of +0.24 C/decade. Objections have been made to that study by me (e.g. here) and others, not the least of which is the fact that the 2003-2017 period addressed had a record warm El Nino near the end (2015-16), which means the computed warming trend over that period is not entirely human-caused warming.

If we look at the warming over the 19-year period 2000-2018, we see the record El Nino event during 2015-16 (all monthly anomalies are relative to the 2001-2017 average seasonal cycle):


See also Spencer’s blog

The Little Ice Age: What Happened Around the World

by Marcia Wendorf, May 15, 2019 in InterestingEngineering


Between 1300 and 1850, the Earth experienced a Little Ice Age whose cause to this day is not known.

During the period 950 CE to 1250 CE, the earth experienced an unusually warm period, which became known as the Medieval Warm Period (MWP) or the Medieval Climatic Anomaly. At their height, temperatures during that period were similar to those experienced during earth’s mid-20th-century warming period.

Following the Medieval Warm Period came a period of intense cold, which has become known as the Little Ice Age (LIA). The term “Little Ice Age” was coined by Dutch-born American geologist F.E. Matthes in 1939. The LIA began around 1300 CE and lasted until about 1850 CE.

Within that stretch, NASA’s Earth Observatory has described three particularly cold periods: one around 1650, a second around 1770, and the third around 1850.

Solutions au réchauffement climatique : des universitaires de Cambridge tentent de trouver un moyen de re-geler l’Arctique

by F. Gervais, 15 mai 2018, in Atlantico


Atlantico : Quelles solutions envisagées par la communauté scientifique sont aujourd’hui les plus plausibles pour infléchir réellement le réchauffement climatique ? Pour l’inverser ?

François Gervais : La température moyenne de la Planète a augmenté de l’ordre de 1°C depuis le début du siècle dernier. Mais selon les données du Hadley Center britannique (HADCRUT4), 60 % de cette hausse s’est produite de 1910 à 1945 alors que les émissions de CO2 étaient 6 à 10 fois inférieures à ce qu’elles sont de nos jours, plaidant pour une cause principalement naturelle. Durant les 74 années suivantes, la température n’a augmenté que de 0,4°C en dépit de l’accélération des émissions à partir de 1945. Ce ne sont donc pas les observations qui sont inquiétantes mais les projections des modèles de climat repris par le GIEC. Leur problème est toutefois qu’ils ne sont pas d’accord entre eux, prévoyant des hausses avec une incertitude dans un rapport de 1 à 3, incertitude qui ne s’est pas réduite en 40 ans d’études en dépit de moyens considérables. Un corpus de 3000 publications dans des revues internationales conclut en revanche à une prééminence de la variabilité naturelle du climat sur la contribution anthropique. Cela dit, réduire notre addiction au carbone est sans doute sage car les ressources ne sont pas inépuisables. Mais jouer aux apprentis sorciers avec la géo-ingénierie est plus discutable. Et à quoi bon puisque des astronomes prévoient une moindre activité solaire dans les années à venir. Les recherches visant à retransformer le CO2 en carburant à partir de la photosynthèse de micro-algues sont intéressantes, surtout si le prix du baril devait considérablement augmenter à l’avenir. Toutefois, le supplément de CO2dans l’atmosphère a enrichi la biomasse végétale de l’ordre de 20 % comme le vérifie le verdissement de la Planète observé par satellite. Serait-il raisonnable d’en contrarier le bénéfice en particulier pour les plantes nutritives ?

German Employer’s Association Op Ed: “No Expert Politician In Berlin Believes In Switch To Green Energies Any More”

by P. Gosselin, May 14, 2019 in NoTricksZone


As the pressure mounts in Germany to switch off coal power plants and to rapidly transition over to green energies, one gets the feeling that it all has more to do with a desperate, last-ditch effort by the green energy proponents to rescue their pet green project.

Behind closed doors, no one in Berlin believes in it

Now, just days ago, energy expert Dr. Björn Peters wrote at the German Association of Employers site that the Energiewende has deteriorated to the point that: “No specialist politician in Berlin believes in the success of the Energiewende any more. Whoever you ask, everyone says this only behind closed doors and thinks that if you go to the press with it you can only lose against the ‘green’ media mainstream.”

Peters warns that what is needed in Germany is a good dose of reality and “a fresh start on energy policy.”

Advantages of fossil fuels “too great”

The German expert writes that despite the hundreds of billions of euros committed to green energies, “chemical energy from coal, oil and gas supplies about four fifths of primary energy worldwide and also in Germany and thus represents the present energy supply”.

Germany, Poland snub EU appeal for greater climate ambition

by Frédéric Simon, May 7, 2019 in Euractiv


The governments of France, the Netherlands, Belgium, Sweden, Denmark, Spain, Portugal and Luxembourg have launched an appeal to boost EU climate action ahead of a major summit on the future of Europe taking place in Romania next Thursday (9 May).

A leaked “non-paper” by the eight countries calls on the European Union to step up the fight against climate change and sign up to a European Commission plan to achieve net-zero greenhouse gas emissions “by 2050 at the latest”.

Germany, Italy and Poland were notably absent from the list of signatories of the leaked document, obtained by EURACTIV, echoing divisions at a recent EU summit.

Climate data shows no recent warming in Antarctica, instead a slight cooling

by Anthony Watts, May 10, 2019 in WUWT


Below is a plot from a resource we have not used before on WUWT, “RIMFROST“. It depicts the average temperatures for all weather stations in Antarctica. Note that there is some recent cooling in contrast to a steady warming since about 1959.


Data and plot provided by
http://rimfrost.no 

Contrast that with claims by Michael Mann, Eric Steig, and others who used statistical tricks to make Antarctica warm up. Fortunately, it wasn’t just falsified by climate skeptics, but rebutted in peer review too.

New Study: The Tropical Atlantic Was 7.5°C Warmer Than Now While CO2 Was 220 ppm

by K. Richard, May 9, 2019 in NoTricksZone


Another new paper published in Paleoceanography and Paleoclimatology casts further doubt on the paradigm that says CO2 has historically been a temperature driver.

Evidence from the tropical Atlantic indicates today’s regional temperatures (15.5°C) are 7.5°C colder than a peak temperatures (23°C) between 15,000 to 10,000 years ago, when CO2 hovered around 220 ppm.

Does NASA’s Latest Figures Confirm Global Warming?

by Anthony Watts, May 9, 2019 in ClimateChangeDispatch


That’s an indication of the personal bias of co-author Schmidt, who in the past has repeatedly maligned the UAH dataset and its authors because their findings didn’t agree with his own GISTEMP dataset.

In fact, Schmidt’s bias was so strong that when invited to appear on national television to discuss warming trends, in a fit of spite, he refused to appear at the same time as the co-author of the UAH dataset, Dr. Roy Spencer.

A breakdown of several climate datasets, appearing below in degrees centigrade per decade, indicates there are significant discrepancies in estimated climate trends:

  • AIRS: +0.24 (from the 2019 Susskind et al. study)
  • GISTEMP: +0.22
  • ECMWF: +0.20
  • RSS LT: +0.20
  • Cowtan & Way: +0.19
  • UAH LT: +0.18
  • HadCRUT4: +0.17

Which climate dataset is the right one? Interestingly, the HadCRUT4 dataset, which is managed by a team in the United Kingdom, uses most of the same data GISTEMP uses from the National Oceanic and Atmospheric Administration’s Global Historical Climate Network.

Impossible research produces 400-year El Niño record, revealing startling changes

by Charles the moderator, May 7, 2019 in WUWT


University of New South Wales

Melbourne: Australian scientists have developed an innovative method using cores drilled from coral to produce a world first 400-year long seasonal record of El Niño events, a record that many in the field had described as impossible to extract.

The record published today in Nature Geoscience detects different types of El Niño and shows the nature of El Niño events has changed in recent decades.

This understanding of El Niño events is vital because they produce extreme weather across the globe with particularly profound effects on precipitation and temperature extremes in Australia, South East Asia and the Americas.

The 400-year record revealed a clear change in El Niño types, with an increase of Central Pacific El Niño activity in the late 20th Century and suggested future changes to the strength of Eastern Pacific El Niños.

“We are seeing more El Niños forming in the central Pacific Ocean in recent decades, which is unusual across the past 400 years,” said lead author Dr Mandy Freund.

“There are even some early hints that the much stronger Eastern Pacific El Niños, like those that occurred in 1997/98 and 2015/16 may be growing in intensity.”

This extraordinary result was teased out of information about past climate from coral cores spanning the Pacific Ocean, as part of Dr Freund’s PhD research at the University of Melbourne and the Centre of Excellence for Climate Extremes. It was made possible because coral cores – like tree rings – have centuries-long growth patterns and contain isotopes that can tell us a lot about the climate of the past. However, until now, they had not been used to detect the different types of El Niño events.

Current Solar Cycle Among Weakest On Record. Potentially Cloud-Seeding Cosmic Radiation Near Highest Level Since

by Prof. F. Vahrenholt and F. Bosse, May 7, 2019 in NoTricksZone


If we speak of an average of the last 23 cycles in the months of the minimum, our only significant energy source at the center of the solar system was below average active last month as well.

The sunspot number (SSN) was 9.1, which was thus only 42% of the average of the cycles for month no. 125. Some cycles (No. 21, 18, 16, 15, 8 ) were already completed in month no. 125.

Fig. 1: The monthly sunspot activity of the current solar cycle (SC 24) since December 2008 (red) compared to the mean value of all previously systematically observed cycles since the beginning of SC 1 in March 1755 (blue) and the very similar SC 5 (black).

Figure 1 clearly shows that the latest cycle was quite below-normal, especially at the beginning and after the second peak which had an SSN of over 140 towards the end. Since February 2014 (the maximum of the entire cycle 24 with SSN = 146 in cycle month 63), it only reached 2/3 of the average activity.

What are the effects? The total radiation (TSI for total solar irradiance) is only moderately influenced: