Archives de catégorie : climate and geology

Switching on the Atlantic heat pump

by Stockholm University, August 27, 2019 in WUWT/fromNature


34 million years ago the warm ‘greenhouse climate’ of the dinosaur age ended and the colder ‘icehouse climate’ of today commenced. Antarctica glaciated first and geological data imply that the Atlantic meridional overturning circulation, the global ocean conveyor belt of heat and nutrients that today helps keep Europe warm, also started at this time. Why exactly, has remained a mystery.

“We have found a new trigger to explain the start-up of the Atlantic current system during the greenhouse-icehouse climate transition: During the warm climate, buoyant fresh water flooded out of the Arctic and prevented the ocean-sinking that helps power the conveyor. We found that the Arctic-Atlantic gateway closed due to tectonic forces, causing a dramatic increase in North Atlantic salinity. This caused warming of the North Atlantic and Europe, and kickstarted the modern circulation that keeps Europe warm today,” says David Hutchinson, researcher at the Department of Geological Sciences, Stockholm University, and lead author of the article published in Nature Communications.

The team of scientists, from the Bolin Centre for Climate Research, used a combination of geophysical data and climate modelling to show that the freshwater transport through the Arctic-Atlantic gateway plays a critical role in controlling the overturning circulation.

‘MASSIVE POOL’ OF METHANE HIDDEN DEEP BENEATH EARTH’S SURFACE DISCOVERED BY SCIENTISTS

by Hannay Osborne, 21 August 2019 in Newsweek from PNAS


A huge source of methane has been discovered deep beneath the surface of Earth, sitting between the upper mantle and lower oceanic crust. The discovery is important as it could provide an insight into the hydrothermal vents that may have helped the planet’s first life emerge. Researchers also argue it could be a source of hydrogen and methane on other planets in the solar system—”even those where liquid water is no longer present.”

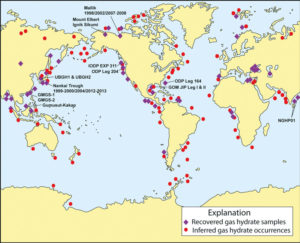
The ‘abiotic’ methane—methane that is not formed with organic matter—was found locked inside rocks. Researchers from the Woods Hole Oceanographic Institution (WHOI), Massachusetts, took 160 samples from hydrothermal sites across the globe, including the Mid-Atlantic Ridge, Guaymas Basin, the East Pacific Rise and the Mid-Cayman Rise. After analyzing them with a laser-based microscope, they found that almost all contained pockets of methane.

In their study, published in the journal PNAS, the team says this could be the biggest source of abiotic methane in the world. This reservoir, they say, could account for more methane than was in Earth’s atmosphere before the onset of the industrial era.

The methane appears to have formed by reactions between trapped water and olivine, a group of rock-forming minerals found in the planet’s subsurface. When seawater moves through the deep ocean crust, it mixes with magma-hot olivine. When the mineral cools, the water is trapped inside and a chemical reaction takes place, leading to the formation of hydrogen and methane.

Traditionally, we think of methane—a potent greenhouse gas—as forming when organic material breaks down. When it is emitted into the atmosphere, it has a warming effect far greater than carbon dioxide, although it is far shorter-lived than the latter, disappearing after about a decade.

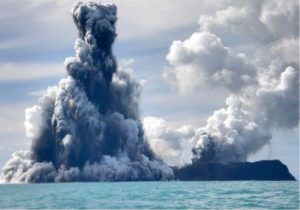
However, methane is also known to exist on the seafloor. It is released through deep-sea vents—geothermally heated fissures on Earth’s crust. In 2016, scientists with the Ocean Exploration Trust discovered over 500 methane spewing vents off the west coast of the U.S.

However, the source of the seafloor methane has remained something of a mystery. “Identifying an abiotic source of deep-sea methane has been a problem that we’ve been wrestling with for many years,” study author Jeffrey Seewald, a senior scientist at WHOI, said in a statement.

Lead author Frieder Klein added: “We were totally surprised to find this massive pool of abiotic methane in the oceanic crust and mantle. Here’s a source of chemical energy that’s being created by geology.”

Fire from Ice: A Case Study of Methane Hydrates in the Eastern Mediterranean

by E. Zogopoulos, August 13, 2019 in EnergyIndustryeView


Methane hydrates is a source of methane gas which is found in crystalline formation that look like ice and can be found in permafrost regions or under the sea in outer continental margins.

We are living in times of fundamental changes in the energy landscape, driven by uncertainty, unstable energy prices, disruptive technologies, geopolitical gambits and subsequent attempts for regulatory interventions. While governments and corporations are trying to adjust to the new landscape and guess the name of the game, they need reliable sources of power to make predictions and critical strategic decisions.

Historical & geopolitical context

The era of hydrocarbons does not seem to be over, but there might be some indications in the horizon. We like it or not, they will still account for the vast majority of the global energy mix by 2050, despite significant breakthroughs in renewables. Many new players come in the energy market with the elusive promise of additional and cheaper resources and the will to disrupt the game – and eventually make money out of it.

Furthermore, the growing tension between public policy and private initiatives has been boiling and has been more than just an understatement for decades. The under-investment that we observe now due to lower prices and risks could become chronic and the global output of energy resources could lead to secure supply deficit.

Gas is believed to gradually replace coal, which is a source of distress for some existing players. The world is facing a proliferation of Liquified Natural Gas (LNG) supplies that are already impacting gas markets and competing with pipeline gas. Some of the largest and most significant consuming nations are contemplating reform or unbundling, which could mean some take or pay contracts become stranded and an increasing oil price is likely to reinforce the price arbitrage between long-term and spot pricing.

There is undeniably a constant call for further investments in renewables, but lower oil, gas and coal prices and increased efficiency (or very effective lobbying) might slow this down. The global players do take into consideration the call for renewables (like solar and wind energy), either for publicity purposes or even because they do believe that this could be the future.


Location of sampled and inferred methane hydrate occurrences in oceanic sediment of outer continental margins and permafrost regions. Most of the recovered methane hydrate samples have been obtained during deep coring projects or shallow seabed coring operations. Most of the inferred methane hydrate occurrences are sites at which bottom simulating reflectors (BSRs) have been observed on available seismic profiles. The methane hydrate research drilling projects and expeditions reviewed in this report have also been highlighted on this map. (Map courtesy of Timothy S. Collett, USGS)

Ten years of icy data show the flow of heat from the Arctic seafloor

by US Geological Survey, August 8, 2019 in ScienceDaily


Scientists have taken the temperature of a huge expanse of seafloor in the Arctic Ocean in new research by the U.S. Geological Survey and the Geological Survey of Canada. The study, published in the Journal of Geophysical Research, is accompanied by the release of a large marine heat flow dataset collected by the USGS from an ice island drifting in the Arctic Ocean between 1963 and 1973. These never-before-published data greatly expand the number of marine heat flow measurements in the high Arctic Ocean.

Marine heat flow data use temperatures in near-seafloor sediments as an indication of how hot Earth’s outer layer is. These data can be used to test plate tectonic theories, provide information on oil and gas reservoirs, determine the structure of rock layers and infer fluid circulation patterns through fractures in those rock layers.

La hausse du niveau de la mer accélère-t-elle l’érosion des côtes? (1/3)

by Y. Battiau-Queney, 15 août 2019 in ScienceClimatEnergie


Il est courant de lire et d’entendre que la hausse du niveau de la mer, l’une des conséquences les plus manifestes du réchauffement climatique, va accélérer l’érosion de nos côtes, menacer de submersion marine de vastes zones littorales urbanisées et faire disparaître nombre d’îles basses habitées. Ces craintes sont-elles justifiées? Comme un consensus ne vaut pas vérité scientifique, on va essayer de démêler le vrai du faux en partant de l’état des connaissances scientifiques sur la hausse du niveau de la mer et analyser ses effets possibles sur les processus d’érosion des côtes.


1/ Que sait-on de la hausse du niveau de la mer ?

1.1. État des connaissances sur les variations passées et présentes du niveau de la mer à l’échelle mondiale

Une bonne synthèse récente sur les causes et l’ampleur de la hausse du niveau de la mer se trouve dans Cazenave et Le Cozannet (2014). On y trouvera une très abondante bibliographie antérieure à 2013. Les méthodes utilisées par les scientifiques pour évaluer la tendance moyenne de l’élévation du niveau de la mer dépendent de la période considérée. A l’échelle du Pléistocène (1 800 000 ans) et de l’Holocène (10 000 ans) on dispose d’archives sédimentologiques (repérage d’anciennes plages “soulevées”, analyse de niveaux tourbeux recouverts de sédiments marins, stratigraphie et datation de récifs coralliens …) et de données archéologiques, particulièrement riches sur les côtes méditerranéennes. On sait qu’à plusieurs reprises, pendant les phases interglaciaires du Pléistocène, le niveau de la mer a été supérieur à l’actuel de 5 à 10 m au moins (Planton et al., 2015). À partir du milieu du 19ème siècle, on utilise les données souvent précises des marégraphes installés principalement dans les ports de l’hémisphère nord. Elles fournissent les altitudes relatives du niveau de la mer par rapport aux terres émergées. Depuis 1993, les données satellitaires fournissent des altitudes absolues du niveau de la mer par rapport à l’ellipsoïde terrestre de référence et permettent d’avoir une vision beaucoup plus globale des variations du niveau des océans à toutes les latitudes et longitudes.

Tableau 1 : variations du niveau de la mer indiquées par les marégraphes (sources: SONEL et GLOSS; Wöppelmann et al., 2014 pour Marseille) (ND= non documenté). Les données dans les colonnes sont exprimées en mm/an.

Anthropocene: “it will be the rocks that have the final say” about this fake word.

by David Middleton, August 7, 2019 in WUWT


The fake geologic epoch known as the “Anthropocene” just won’t die… It’s like a zombie from a bad science fiction movie.

Despite being populated with activists like Naomi Oreskes, it has taken the AWG ten years to vote on what their conclusion will be and to start looking for evidence to support their conclusion… And the vote wasn’t unanimous.

Here’s where the Anthropocene dies…


Figure 4 from Finney & Edwards.  “Workflow for approval and ratification of a Global Standard Stratotype Section and Point (GSSP) proposal. Extensive discussion and evaluation occurs at the level of the working group, subcommission, and International Commission on Stratigraphy (ICS) Bureau. If approved at these successive levels, a proposal is forwarded to the International Union of Geological Sciences (IUGS) for ratification. This process is also followed for other ICS decisions on standardization, such as approval of names of formal units, of revisions to the units, and to revision or replacement of GSSPs.”

Slowest start to Atlantic Hurricane season since 2004

by Anthony Watts, August 7, 2019 in WUWT


Watching the current maps and models, it appears the 2019 Atlantic Hurricane Season is off to a slow start. For people that the depend on disaster porn (climate alarmists, media) that means no weather events to claim as being climate driven.


Graph of tropical storm and hurricane frequency, Atlantic region, monthly, based on data from 1851-2017. Data from NOAA at http://www.aoml.noaa.gov/hrd/tcfaq/E17.html Landsea, Chris (contributor from the NHC). “Total and Average Number of Tropical Cylones by Month (1851-2017)”. aoml.noaa.gov. National Oceanic and Atmospheric Administration, Atlantic Oceanographic and Meteorological Laboratory. Archived from the original on September 1, 2018.  Graph from RCraig.

Relation entre l’ activité sismique dans les océans et le réchauffement global (août 2019)

c/o Luc Trullemans,  août 2019 in PublicMétéo


Introduction

Une forte relation à été observée ces dernières années entre de l’activité sismique dans les océans et le récent réchauffement climatique  (CSARGW ,Correlation of Seismic Activity and Recent Global Warming) .

Cette corrélation entre de l’activité sismique océanique et le réchauffement climatique avait déjà été remarquée de 1979 à 2016 (CSARGW16) et vient d’être confirmée jusqu’en 2018.

Dans cette note, on démontre que  l’activité sismique dans les océans ( =>tremblements de terre de magnitude 4-6) provoque des flux géothermiques sous-marins et ont une relation importante avec les fluctuations de la température globale des océans (SST) et de la température globale de l’air (GT).

Ceci avance une nouvelle l’hypothèse selon laquelle l’activité sismique océanique pourrait être  un des paramètres  les plus importants dans la variation de la température globale.


Volcanism Altering Bering Sea Eco-Systems, Not Climate Change

by James  E. Kamis, July 8, 2019 in ClimateChangeDispatch


Volcanism, primarily ocean floor in nature, is the most feasible and plausible cause of recent alterations to the Bering Sea physical and biological systems, not climate change.

Since 2014, multiple changes to the Bering Sea’s physical and biological systems such as a rise in seawater temperature, sea ice melting, alteration of commercial fish migration patterns and the very sudden die-off of certain sea bird species have made front-page news.

Many scientists have been quick to attribute these supposedly ‘unnatural’ events to human-induced atmospheric warming or climate change without mentioning or giving due consideration to emissions from active volcanic features that circumvent the entire Bering Sea and populate its seafloor.

This immediate jump to a climate change cause and event effect relationship is especially difficult to understand knowing that frequently during the last five years we have been informed of yet another eruption from a Bering Sea area volcano located in either Russia, Alaska, or on the Bering seafloor.

So, let’s take a moment to review Bering Sea volcanic activity and its likely effect on the area’s physical and biological systems.

More ‘reactive’ land surfaces cooled the Earth down

by Charles the moderator , July 6, 2019 in WUWT


Higher reactivity could explain temperature drop before last ice age

GFZ GeoForschungsZentrum Potsdam, Helmholtz Centre

From time to time, there have been long periods of cooling in Earth’s history. Temperatures had already fallen for more than ten million years before the last ice age began about 2.5 million years ago. At that time the northern hemisphere was covered with massive ice masses and glaciers. A geoscientific paradigm, widespread for over twenty years, explains this cooling with the formation of the large mountain ranges such as the Andes, the Himalayas and the Alps. As a result, more rock weathering has taken place, the paradigm suggests. This in turn removed more carbon dioxide (CO2) from the atmosphere, so that the ‘greenhouse effect’ decreased and the atmosphere cooled. This and other processes eventually led to the ‘ice Age’.

In a new study, Jeremy Caves-Rugenstein from ETH Zurich, Dan Ibarra from Stanford University and Friedhelm von Blanckenburg from the GFZ German Research Centre for Geosciences in Potsdam were able to show that this paradigm cannot be upheld. According to the paper, weathering was constant over the period under consideration. Instead, increased ‘reactivity’ of the land surface has led to a decrease in CO2 in the atmosphere, thus cooling the Earth. The researchers published the results in the journal Nature.

Scientist Spots High Geothermal Heat Flux In East Greenland – ‘Dramatic Consequences For Ice Basal Melting’

by K. Richard, July 5, 2019 in NoTricksZone


Geothermal heat flux can foment upper mantle temperature anomalies of 800–1000 °C, and these extreme heat intensities have been found to stretch across 500 km of central-east Greenland. This could result in “a significant contribution of ice melt to the ice-drainage system of Greenland” (Artemieva et al., 2019).

Evidence of more than 100,000 formerly or currently active volcanic vents permeate the Earth’s sea floor (Kelley, 2017).

Active volcanoes spew 380°C sulfuric acid and “metal-laden acidic fluids” into the bottom waters of the world ocean on a daily basis. In other words, literal ocean acidification is a natural phenomenon.

The carbon dioxide concentrations present in these acidic floods reach “astounding” levels, dwarfing the potential for us to even begin to appreciate the impact this explosive geothermal activity has on the Earth’s carbon cycle (Kelley, 2017).

About Antarctica

by Thongchai Thailand, June 27, 2019


THIS POST IS A CRITICAL EXAMINATION OF VARIOUS CLAIMS MADE BY CLIMATE SCIENCE ABOUT THE IMPACT OF CLIMATE CHANGE ON ANTARCTICA AND OF THE EVIDENCE FOR AGW CLAIMED TO BE FOUND IN DATA FROM ANTARCTICA.
IT IS BASED ON THE ANTARCTICA SECTION OF A LECTURE BY JAMES EDWARD KAMIS  [LINK]
  1. Antarctica is broken into two pieces. On the west is West Antarctica that constitutes 20% of Antarctica. The upper portion of West Antarctica forms a thumb. It’s called the Antarctic Peninsula. The remaining 80% of Antarctica is called East Antarctica. The right image shows a NASA graph that reflects ice melting on the entire continent from 1995 to 2015. It is here shown as a proxy for ice melting denominated as millimeters of sea level rise due to meltwater. Note that West Antarctica, inclusive of the Antarctic Peninsula, the 20% portion of the continent, accounts for all of the continent’s ice loss. East Antarctica, the much larger 80%, is actually gaining ice. This melt graph was created in 2015 by Dr. H. Jay Zwally is Chief Cryospheric Scientist at NASA’s Goddard Space Flight Center and Project Scientist for the Ice Cloud and Land Elevation Satellite.
  2. The lopsided melt data raises this question: why is all the melt concentrated in 20% of the continent while the other 80% gains ice? The answer is found in the University of Washington 50-year average surface temperature map. It was generated in 2009 by Dr. Eric Steig – Earth and Space Sciences – University of Washington. It’s validity was hotly debated for many years. However, since that time, it has been proven correct by two more modern studies. NASA’s skin temperature map and British Antarctic Survey’s temperature map.
  3. The surface temperature map that Dr. Steig made represents the temperature of the upper few meters of ice and sediment and does not reflect the temperature of the atmosphere…

More Failed Predictions: May Was The Second Wettest Month In US History

by Chriss Street, June 28, 2019 in ClimateChangeDispatch


National Oceanic and Atmospheric Administration reported the month of May was the second wettest and temperatures were in the bottom-third for its 125-year US history.

The 2010 publication titled, ‘A Global Overview Of Drought and Heat-Induced Tree Mortality Reveals Emerging Climate Change Risks for Forests’, was accepted by the Obama administration as scientific evidence that climate change had made the Earth:

“…increasingly vulnerable to higher background tree mortality rates and die-off in response to future warming and drought, even in environments that are not normally considered water-limited.”

But NOAA just reported that May US precipitation totaled an average of 4.41 inches, 1.50 inches above average, and ranked second wettest in the 125-year period of record for May as well as second wettest for all months since January 1895.

The only wetter month in US history was May 2015 with 4.44 inches of precipitation.

The 37.68 inches of precipitation across the contiguous U.S. from June 2018 to May 2019 shattered the previous 1982-83 12-month period by 1.48 inches.

Near-record to record precipitation was observed from the West Coast through the central Plains and into the Great Lakes and parts of the Northeast.

As a result, severe May flooding was observed along the Arkansas, Missouri, and Mississippi rivers. Vicksburg, MS, reported ongoing flooding since mid-February.

Truth(?) in testimony and convincing policy makers

by Judith Curry , June 28, 2019 in WUWT


Some reflections, stimulated by yesterday’s Congressional Hearing, on the different strategies of presenting Congressional testimony.

Yesterday’s Hearing provided an ‘interesting’ contrast in approaches to presenting testimony, when comparing my testimony with Michael Mann’s.

What are the purposes of expert testimony?

There is an interesting document entitled A Guide to Expert Testimony for Climate Scientists, funded by the US National Science Foundation.  Most of this is related to court room hearings, but some is relevant for Congressional Hearings.  Excerpts:


Experts may do one or more of the following:

  • Provide the decision-maker with factual information and background to provide the decision-maker with an adequate context for the decision.
  • Apply expert knowledge to the facts of a case and render an opinion about the facts, such as whether certain conditions actually caused an effect.
  • Explain scientific principles and theories to the decision-maker.
  • Extrapolate from the actual facts or hypothetical facts and rendering an opinion regarding the likelihood of an event or occurrence. Experts may speculate on events or occurrences because of their special knowledge or training.
  • Provide an opinion that contradicts or undermines the opinions or conclusions of an expert who testified for the opposing party.

If you are assigned to cross-examine an expert, you should prepare questions that test and challenge the witness on the following subjects :

  • Lack of thoroughness in investigating the facts or data;

  • Insufficient testing of the facts or data;

  • Lack of validity and reliability in testing of facts or data;

  • Existence of other causes or explanations for conclusions or outcomes;

  • Show differences of opinion among experts

How geologic forces are melting southern Greenland ice sheet

by J.E. Kamis, May 25, 2016 in ClimateChangeDispatch


The most plausible scenario for southern Greenland’s surface ice melt is related to geologically induced heat flow and not atmospheric warming for various, well-established reasons. Based on research by the National Oceanic and Atmospheric Administration (NOAA) (see here), the top surface of southern Greenland’s ice sheet is currently melting at a high rate and therefore greatly reducing surface ice volume. They attribute this geographically localized melting effect to an unusually persistent and man-made atmospheric high pressure system (a so-called Omega Block) that has remained stationary above southern Greenland during the spring of 2016.

This non-moving high-pressure system has trapped a cell of very warm air above southern Greenland resulting in higher-than-normal surface ice melting rates and volumes. NOAA and the mainstream media are portraying this above-average melting as undeniable proof man-made global warming damaging our planet.

This portrayal is vastly misleading.

That’s because southern Greenland’s surface ice melt is more likely caused by natural, geologically induced heat flow from one of Earth’s largest Deep Ocean crustal plate junctures, the 10,000 mile long Mid-Atlantic Ridge (MAR). The Mid-Atlantic Ridge is “an immensely long mountain chain extending for about 10,000 miles (16,000 km) in a curving path from the Arctic Ocean to near the southern tip of Africa. The ridge is equidistant between the continents on either side of it. The mountains forming the ridge reach a width of 1,000 miles.”

Multiple NASA Studies Confirm Bedrock Heat Flow Behind Melting Polar Ice, Not Global Warming

by James E. Kamis, August 7, 2018 in ClimateChangeDispatch

In what amounts to dissension from National Aeronautics and Space Administration (NASA) climate change policy, a series of just-released studies by working-level scientists prove that geological and not atmospheric forces are responsible for melting of Earth’s polar ice sheets.


NASA Greenland Study August 1, 2018

The results of this research study illustrated in Figure 2 confirm the very high geothermal bedrock heat-flow from Greenland’s massive subglacial Mantle Plume, which was originally documented in four previous research studies (see herehere, here, and here).

A geothermal heat-flow cause for the melting of Greenland’s ice sheet has been the focus of numerous Climate Change Dispatch articles (see here, here, here, and here).


The Holocene Sea Level Highstand

by David Middleton, June 6 , 2019 in WUWT


What is a highstand?

A highstand is one phase of the sea level cycle (AAPG Wiki)

  • Rising
  • Highstand
  • Falling
  • Lowstand

The highstand is the maximum sea level achieved during the cycle.

The Holocene Epoch

The Holocene Epoch was recently formally subdivided into three stages:

  1. Greenlandian Stage = Lower or Early-Holocene. 11.70 ka to 8.33 ka
  2. Northgrippian Stage = Middle or Mid-Holocene. 8.33 ka to 4.25 ka
  3. Meghalayan Stage = Upper or Late-Holocene. 4.25 ka to present

The abbreviation “ka” refers to thousands of years ago. Lower, Middle and Upper are generally used when referring to rock-time units. Early, Mid and Late are generally used when referring to time units (Haile, 1987). Prior to the formal subdivision, Lower/Early, Middle/Mid and Upper/Late were commonly used; however there was no formal nomenclature. The fake word, “Anthropocene” is not used by real geologists.

There is also an informal climatological subdivision of the Holocene:

  • Preboreal 10 ka–9
  • Boreal 9 ka–8 ka
  • Atlantic 8 ka–5 ka
  • Subboreal 5 ka–2.5 ka
  • Subatlantic 2.5 ka–present

Source: Wikipedia

Why would there have been a Mid- to Late-Holocene highstand?

Figure 1. Holocene sea level curves from Moore & Curray, 1974.

The epic search for oldest ice in Antarctica is starting

by Università Ca’ Foscari Venezia, June 5, 2019 in WUWT


Click here for project video.

On 1st June 2019 the European Beyond EPICA Oldest Ice Core project started with the aim of drilling for and recovering ice from up to 1.5 Million years ago in Antarctica. The previous EPICA project recovered ice from 800,000 years ago. The new project aims to go beyond that. The new core will give us information on the greenhouse gases present during the Middle Pleistocene Transition (MPT), which occurred between 900,000 and 1.2 Million years ago. During this period the climatic periodicity transitioned from 41,000 to 100,000 years between ice ages. Why this change happened is the mystery scientists want to resolve.

To do this, experts from 10 European Countries and 16 different Research Institutions have joined forces under the guidance of Carlo Barbante and his management team at the CNR and Ca’ Foscari University of Venice in Italy, funded by the European Horizon 2020-research programme.

For further information visit https://www.beyondepica.eu/

Tertiary hyperthermal events: precursors of the current situation?

by A. Jacobs & A. Préat, May 20, 2019 in SSRN.Elsevier


The focus of this study is based on a detailed analysis of the hyperthermal events of the

Paleocene / Eocene limit of 56 Ma and the lower Eocene (for the 54-52 Ma interval, Figure 1).

This example will show that the Earth has experienced many times much higher temperatures

than today, with warmer, sometimes more acidic oceans and an atmosphere much richer in CO2

(or CH4) than the current one. Are these past events precursors of the current situation?

Keywords: global warming, climate change, Paleocene, Eocene, hyperthermal events

140 Years to a PETM-Style Doomsday!!! Another PETM/Chicken Little of the Sea Epic Fail

by David Middleton, May 18, 2019 in WUWT


Gingerich, 2019 is a recent paper reiterating the PETM Chicken Little of the Sea meme. In the comments section of a recent post, it was cited as evidence of imminent catastrophe and followed up by a comment featuring this image from Clean Tecnica:

I just had to track this back to the Clean Tecnica article… Their scientific prowess is almost always laughable… And I was not disappointed.

The Relationship between Atmospheric Carbon Dioxide Concentration and Global Temperature for the Last 425 Million Years

by William J. Davis, September 2017, in ResearchGate


Assessing human impacts on climate and biodiversity requires an understanding of the relationship between the concentration of carbon dioxide (CO2) in the Earth’s atmosphere and global temperature (T). Here I explore this relationship empirically using comprehensive, recently-compiled databases of stable-isotope proxies from the Phanerozoic Eon (~540 to 0 years before the present) and through complementary modeling using the atmospheric absorption/transmittance code MODTRAN. Atmospheric CO2 concentration is correlated weakly but negatively with linearly-detrended T proxies over the last 425 million years.

Evénements hyperthermiques du Tertiaire : précurseurs de la situation actuelle?

by  A. Préat & A. Jacobs, 17 avril 2019 in ScienceClimatEnergie


Le but de cet article est de montrer combien la climatologie (actuelle et celle du passé) est complexe et que’ la science est loin d’être dite’. Pour ce qui est de la climatologie actuelle de très nombreux articles existent, dont une partie sur SCE. Pour la climatologie du passé les exemples géologiques ne manquent pas (également quelques articles généraux sur SCE, ici). Le propos de cet article est basé sur une analyse détaillée des événements hyperthermiques de la limite Paléocène/Eocène il y a 56 Ma et de l’Eocène inférieur (pour l’intervalle 54-52 Ma, Figure 1). Cet exemple montrera que la Terre a connu à de nombreuses reprises des températures bien plus élevées que celles d’aujourd’hui, avec des océans plus chauds, parfois plus acides et une atmosphère beaucoup plus riche en CO2 (ou en CH4) que l’actuelle. Cela n’a jamais empêché la vie de se développer, et ‘ironie du sort’ c’est au cours d’un de ces événements hyperthermiques du Tertiaire (ou PETM, voir plus loin), qui fut l’un des plus chauds qu’ait connu la Terre, que les mammifères ont poursuivi une radiation évolutive (= diversification des espèces) sans précédent entamée après l’extinction des dinosaures à la limite Crétacé/Tertiaire [1, 2].


If CO2 Caused Mid-Pliocene Warming, What Caused late-Pliocene Cooling? You Guessed!

by P. Homewood, April 7, 2019 in NotaLotofPeopleKnowThat


ABSTRACT

It is thought that the Northern Hemisphere experienced only ephemeral glaciations from the Late Eocene to the Early Pliocene epochs (about 38 to 4 million years ago), and that the onset of extensive glaciations did not occur until about 3 million years ago. Several hypotheses have been proposed to explain this increase in Northern Hemisphere glaciation during the Late Pliocene. Here we use a fully coupled atmosphere-ocean general circulation model and an ice-sheet model to assess the impact of the proposed driving mechanisms for glaciation and the influence of orbital variations on the development of the Greenland ice sheet in particular. We find that Greenland glaciation is mainly controlled by a decrease in atmospheric carbon dioxide during the Late Pliocene. By contrast, our model results suggest that climatic shifts associated with the tectonically driven closure of the Panama seaway, with the termination of a permanent El Niño state or with tectonic uplift are not large enough to contribute significantly to the growth of the Greenland ice sheet; moreover, we find that none of these processes acted as a priming mechanism for glacial inception triggered by variations in the Earth’s orbit.

https://www.researchgate.net/publication/23222627_Late_Pliocene_Greenland_glaciation_controlled_by_a_decline_in_atmospheric_CO2_levels


….

Bjørn Lomborg on ‘climate strikes’ – normalization of extreme language reflects decades of climate-change alarmism

by Anthony Watts, March 19, 2019 in WUWT


It is little wonder that kids are scared when grown-ups paint such a horrific picture of global warming.

For starters, leading politicians and much of the media have prioritized climate change over other issues facing the planet. Last September, United Nations Secretary-General António Guterres described climate change as a “direct existential threat” that may become a “runaway” problem. Just last month, The New York Times ran a front-page commentary on the issue with the headline “Time to Panic.” And some prominent politicians, as well as many activists, have taken the latest report from the United Nations Intergovernmental Panel on Climate Change (IPCC) to suggest the world will come to an end in just 12 years.

Weird science: Tectonics in the tropics trigger Earth’s ice ages, study finds

by Anthony Watts, March 15, 2019 in WUWT


Over the last 540 million years, the Earth has weathered three major ice ages — periods during which global temperatures plummeted, producing extensive ice sheets and glaciers that have stretched beyond the polar caps.

Now scientists at MIT, the University of California at Santa Barbara, and the University of California at Berkeley have identified the likely trigger for these ice ages.

In a study published in Science, the team reports that each of the last three major ice ages were preceded by tropical “arc-continent collisions” — tectonic pileups that occurred near the Earth’s equator, in which oceanic plates rode up over continental plates, exposing tens of thousands of kilometers of oceanic rock to a tropical environment.

The scientists say that the heat and humidity of the tropics likely triggered a chemical reaction between the rocks and the atmosphere. Specifically, the rocks’ calcium and magnesium reacted with atmospheric carbon dioxide, pulling the gas out of the atmosphere and permanently sequestering it in the form of carbonates such as limestone.

Over time, the researchers say, this weathering process, occurring over millions of square kilometers, could pull enough carbon dioxide out of the atmosphere to cool temperatures globally and ultimately set off an ice age.