Archives par mot-clé : Fun?/Discussion

Study: Clouds, Solar Cycles Play Major Role In Climate Change

by  G. Lloyd, July 15, 2010 in ClimateChangeDispatch


Sand deposits near the Gobi Desert in China may seem a strange place to look for evidence that cosmic rays can control how clouds are formed and the impact they have on Earth’s climate.

But Japanese scientists have measured the size of sand grains and the distance they traveled 780,000 years ago to add a new level of understanding to one of the questions that continue to baffle climate science: clouds.

The findings, published in Nature, point to big trends in natural variation of past and future climate that operate apart from greenhouse gas levels.

The study adds weight to a contentious theory by Danish researcher Henrik Svensmark, of the Danish National Space Institute in Copenhagen, which uses cosmic rays and clouds to question the sensitivity of climate to carbon dioxide in the atmosphere.

My new video – Climate Change Reconsidered II: Fossil Fuels

by Anthony Watts, July 14,2019 in WUWT


In the first part of a new video series, I give an outline of Chapter One of Climate Change Reconsidered II: Fossil Fuels, which covers environmental economics. I explain the role of economics in protecting the environment. In a nutshell, it’s this: economic prosperity gives humans the time to care about the environment. Otherwise it’s just a day-to-day battle for survival.

Climate Change Reconsidered II: Fossil Fuels assesses the costs and benefits of the use of fossil fuels (principally coal, oil, and natural gas) by reviewing scientific and economic literature on organic chemistry, climate science, public health, economic history, human security, and theoretical studies based on integrated assessment models (IAMs). It is the fifth volume in the Climate Change Reconsidered series and, like the preceding volumes, it focuses on research overlooked or ignored by the United Nations’ Intergovernmental Panel on Climate Change (IPCC).

Additional background information about Climate Change Reconsidered II: Fossil Fuels is available at these links:

Message from the Coauthors (2-page PDF)
About the Coauthors (1-page PDF)
About NIPCC (1-page PDF)
Impact of Fossil Fuels on Human Health (full-color graphic, PDF)
Complete background package (5-page PDF)


Anchorage “Record” Was Not Actually A Record!

by P. Homewood, July 14, 2019 in NotaLotofPeopleKnowThat


The US state of Alaska, part of which lies inside the Arctic Circle, is sweltering under a heatwave, with record temperatures recorded in several areas, including its largest city.

Temperatures reached 90F (32C) in Anchorage on Thursday, shattering the city’s previous record of 85F.

https://www.bbc.co.uk/news/world-us-canada-48890556

The report clearly implied global warming as the cause, with several references to climate change links throughout the article.

As I pointed out at the time, the all-time record temperature for Alaska was set as long ago as 1915, when an incredible 100F was measured at Fort Yukon.

This story follows the usual BBC recipe for Arctic heatwaves:

  • Record temperatures = global warming
  • Hot weather is unprecedented in the Arctic. Most people would believe that temperatures of 90F simply never used to occur in the Arctic, it just sounds so unimaginable.

Unfortunately for the BBC, it turns out that the Anchorage temperature is not even a record!

I have now had time to check through the NOAA data files, and have discovered that back in June 1931, the temperature actually reached 92C at Anchorage:

Land’s complex role in climate change

by  Pielke et al., 2016 in PhysicsToday


To date, most reporting on climate has focused on the possibility of catastrophic warming due to carbon dioxide and other greenhouse gases released into the atmosphere. The assessment of climate change risk has essentially been distilled to a single metric: the global average surface temperature. That reality was evident at the 2015 United Nations Climate Change Conference in Paris, where the central negotiating point was whether the global temperature rise should be limited to 1.5 °C or 2 °C. Indeed, a 2016 opinion piece by Simon Lewis (University College London and the University of Leeds, UK) states that, “by endorsing a limit of 1.5 °C, the [Paris] climate negotiations have effectively defined what society considers dangerous.”

But the reality of humans’ impact on climate is exceedingly complex.2 Even if greenhouse gas emissions could be elimi- nated completely, other harmful anthropogenic sources of cli- mate change would remain. And even if global average tem- peratures were contained, human impacts on climate would manifest in other potentially dangerous ways.

One often overlooked human factor is land use. Deforestation, dry land farming, irrigated agriculture, overgrazing, and other alterations to the natural landscape can disrupt Earth’s natural balances and change weather patterns. As with the addition of CO2into the atmosphere, the effects can last for decades or longer and affect regions distant from the original offense. Given continued rapid population growth, they threaten to be irreversible.

Celebrating America’s Environmental Stewardship

by Jim Steele, July 10, 209 in WUWT


What’s Natural?

Celebrating America’s Environmental Stewardship

I resent the one-sided mis-characterization of humanity as “destroyers of our environment”. Humans certainly had negative impacts on most ecosystems. However, in contrast to a recent United Nations report insinuating we are threatening one million species with extinction, humans have been working hard to restore nature and prevent further extinctions. Most endangered species are still staggering from disruptions initiated centuries ago. But now humans are correcting past mistakes.

Islands have been extinction hotspots. Sixty-one percent of all known extinctions have occurred on islands and 37% of today’s critically endangered species are found only on islands. The main driver of island extinctions has been purposeful or unintentional introductions of alien species. Introduced species are implicated in 81% of all island extinctions. With no natural predators, Island species did not evolve needed behaviors to avoid introduced rats, cats and stoats. Researchers now suggest eradication of rats and other introduced mammals could prevent the extinction of up to 75% of threatened island birds, reptiles and mammals.


Ice Box July: Unusual Cold, Surface Frost Sweep Across Central Europe!

by P. Homewood, July 10, 2019 in NotALotOfPeopleKnowThat


No Tricks Zone has the latest on the coldwave gripping much of Northern Europe. Following a new record low for July set in Lower Saxony last week, there are unconfirmed reports of a new record July low for the whole of the Netherlands:
.
.

From No Tricks Zone:

Where have all the globe-trotting climate ambulance chasers gone? Well, they’re nowhere to be found in Europe nowadays.

The reason is the unusual cold that has swept across a large swath of the continent and which has sent temperatures plummeting to near freezing.

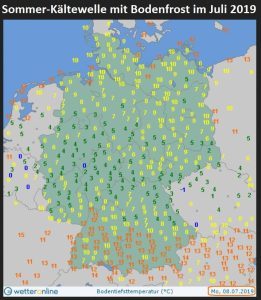
Icebox July: Parts of Central Europe saw ground surface frost yesterday morning. Source: Wetteronline.de

Yesterday morning ground frost hit parts of Belgium, Holland, Germany and the Czech Republic, as the above chart shows. Unsurprisingly, the media have been curiously silent about it.

Record Dutch July low


Climate scientists fiddling the data again and again and again and again

by Paul Matthews, June 30, 2019 in ClimateScepticism


The history of climate scientists adjusting data to try to make recent warming look greater than it really is goes back quite a long way – it’s a regular topic at Paul Homewood’s blogfor example. But climate scientists continue to do it, giving the sceptics plenty of ammunition. Here are three recent blog posts discussing how climate scientists continue to adjust data to exaggerate warming.

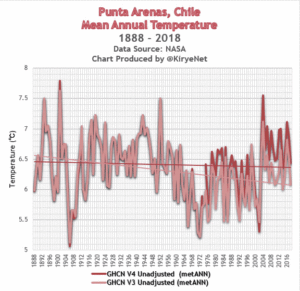
At Pierre Gosselin’s blog there’s a guest post by Kirje from Japan, on NASA GISS temperature adjustments. In the latest GISS version, V4, the supposedly “unadjusted” data sets are different from the unadjusted data in the previous version V3.

Tony Heller has a graph of the 2000, 2017 and 2019 version of NASA GISTEMP, showing that Gavin Schmidt and his team have managed to crank up  warming, particularly in the era of the inconvenient pause. You can also see this effect in fig 2 and fig 4 of the GISS history page.

Here in the UK, the HadCRUT4 team are doing the same thing. Clive Best asks Whatever happened to the Global Warming Hiatus? The answer is that they have demolished it with a sequence of adjustments to the data. HadCRUT3, as published in 2014, shows a clear pause, with no warming from about 2001-2013, but the latest new improved data set HadCRUT4.6 cranks recent temperatures upwards. Clive thought that night be due to including different measurement stations, but checked and found that was not the case. The numbers have simply been adjusted.

….

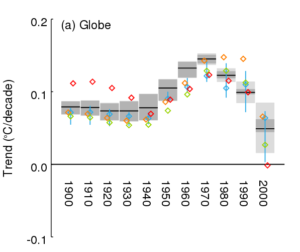
Here the red diamond is the raw data, the green diamond is HadSST3, and the new HadSST4 is shown as the black line, with grey shading representing uncertainty. In the early years of the 20th century, there was global warming that doesn’t fit with the carbon-dioxide-controlled theory of climate scientists, so that is adjusted downwards. But look at the trend over the pause era, since 2000. The raw data shows literally no trend at all. HadSST3 adjusted the trend upwards to create warming, and HadSST4 adjusts things upwards again, roughly doubling the previous adjustment. And this is in an era when the data quality should be excellent, thanks to the introduction of the ARGO float system.

‘Woke’ Climate Scientists Reveal Deep, Hard-Core Biases In New Article

by Judith Curry, July 9, 2019 in ClimateChangeDispatch


It’s getting worse.

About 5 years ago, I wrote two blog posts on climate scientists’ pre-traumatic stress syndrome:

Mother Jones has a new article on the same topic: It’s the end of the world as they know it: The distinct burden of being a climate scientist.

The following scientists were interviewed: Kim Cobb, Priya Shukla, Peter Kalmus, Sarah Myhre, Jacquelyn Gill, Katharine Wilkinson, Eric Holthaus, David Grinspoon, Ken Caldeira.

Lots of ‘trauma,’ read the article to get a flavor. This sentence pretty much sums things up:

“There’s deep grief and anxiety for what’s being lost, followed by rage at continued political inaction, and finally hope that we can indeed solve this challenge. There are definitely tears and trembling voices.”

End of civilization?

The title of the article is: “It’s the end of the world as they know it.” Some selected quotes:

Capture et stockage du CO2 : une situation étrange…

by Claude Mandril, 13 mai 2019 in ConnaissanceDesEnergies


La capture et le stockage de CO2 (CCS(1)) est indispensable…

Les accords de Paris ont donné l’objectif : un réchauffement climatique « well below 2°C » d’ici 2100 par rapport aux températures de l’ère préindustrielle.

Le dernier rapport du GIEC montre par ailleurs qu’on serait « beaucoup mieux » à + 1,5°C, et que tout dixième de degré compte : + 1,7°C vaut mieux que + 1,8°C. Il faut donc, ajoute le GIEC, atteindre la neutralité carbone autour de 2050.

Or il est complètement exclu d’arrêter toutes les émissions de gaz à effet de serre, et de loin ! :

  • l’AIE estime dans son scénario Sustainable Development (le plus contraignant)(2) que les énergies fossiles représenteront encore 60% de la fourniture mondiale d’énergie en 2040. Même si on juge l’AIE timorée, on est clairement hors limite ! ;

  • la capacité d’extraction charbonnière en Chine a augmenté de 6% en 2018 (selon la National Energy Administration en Chine) ;

  •  et surtout, n’oublions pas les émissions « de procédé » (ciment, sidérurgie, chimie, agroalimentaire).

Donc il faudra des « puits » de carbone. En premier lieu, les forêts mais à condition qu’elles soient exploitées et que les produits de cette exploitation donnent un stockage permanent. L’incendie de Notre-Dame de Paris montre que ce n’est pas garanti… L’usage du bois en chaudière réduit les émissions en remplaçant des émissions de carbone fossile, mais ce n’est pas un puits (sauf avec CCS !).

Reste donc la CCS, qui est indispensable. D’ailleurs, sur les 4 scénarios du GIEC, 3 comportent le déploiement de la CCS, le 4e étant un repoussoir.

Et pourtant la CCS est complètement ignorée voire vilipendée, sauf dans une dizaine de pays.

Examinons les critiques ou les objections :


What Humans Contribute to Atmospheric CO2: Comparison of Carbon Cycle Models with Observations

by Herman Harde, April 3, 2019 in Earth Sciences


Abstract: The Intergovernmental Panel on Climate Change assumes that the inclining atmospheric CO2 concentration over

recent years was almost exclusively determined by anthropogenic emissions, and this increase is made responsible for the rising

temperature over the Industrial Era. Due to the far reaching consequences of this assertion, in this contribution we critically

scrutinize different carbon cycle models and compare them with observations. We further contrast them with an alternative

concept, which also includes temperature dependent natural emission and absorption with an uptake rate scaling proportional

with the CO2 concentration. We show that this approach is in agreement with all observations, and under this premise not really

human activities are responsible for the observed CO2 increase and the expected temperature rise in the atmosphere, but just

opposite the temperature itself dominantly controls the CO2 increase. Therefore, not CO2 but primarily native impacts are

responsible for any observed climate changes.

Keywords: Carbon Cycle, Atmospheric CO2 Concentration, CO2 Residence Time, Anthropogenic Emissions,

Fossil Fuel Combustion, Land Use Change, Climate Change


Human CO2 Emissions Have Little Effect on Atmospheric CO2

by Edwin X Berry , June, 2019 in JAtmOceanSciences


Abstract
The United Nations Intergovernmental Panel on Climate Change (IPCC) agrees human CO2 is only 5 percent and natural CO2 is 95 percent of the CO2 inflow into the atmosphere. The ratio of human to natural CO2 in the atmosphere must equal the ratio of the inflows. Yet IPCC claims human CO2 has caused all the rise in atmospheric CO2 above 280 ppm, which is now 130 ppm or 32 percent of today’s atmospheric CO2. To cause the human 5 percent to become 32 percent in the atmosphere, the IPCC model treats human and natural CO2 differently, which is impossible because the molecules are identical. IPCC’s Bern model artificially traps human CO2 in the atmosphere while it lets natural CO2 flow freely out of the atmosphere. By contrast, a simple Physics Model treats all CO2 molecules the same, as it should, and shows how CO2 flows through the atmosphere and produces a balance level where outflow equals inflow. Thereafter, if inflow is constant, level remains constant. The Physics Model has only one hypothesis, that outflow is proportional to level. The Physics Model exactly replicates the 14C data from 1970 to 2014 with only two physical parameters: balance level and e-time. The 14C data trace how CO2 flows out of the atmosphere. The Physics Model shows the 14 CO2 e-time is a constant 16.5 years. Other data show e-time for 12CO2 is about 4 to 5 years. IPCC claims human CO2 reduces ocean buffer capacity. But that would increase e-time. The constant e-time proves IPCC’s claim is false. IPCC argues that the human-caused reduction of 14C and 13C in the atmosphere prove human CO2 causes all the increase in atmospheric CO2. However, numbers show these isotope data support the Physics Model and reject the IPCC model. The Physics Model shows how inflows of human and natural CO2 into the atmosphere set balance levels proportional to their inflows. Each balance level remains constant if its inflow remains constant. Continued constant CO2 emissions do not add more CO2 to the atmosphere. No CO2 accumulates in the atmosphere. Present human CO2 inflow produces a balance level of about 18 ppm. Present natural CO2inflow produces a balance level of about 392 ppm. Human CO2 is insignificant to the increase of CO2 in the atmosphere. Increased natural CO2 inflow has increased the level of CO2 in the atmosphere.

Volcanism Altering Bering Sea Eco-Systems, Not Climate Change

by James  E. Kamis, July 8, 2019 in ClimateChangeDispatch


Volcanism, primarily ocean floor in nature, is the most feasible and plausible cause of recent alterations to the Bering Sea physical and biological systems, not climate change.

Since 2014, multiple changes to the Bering Sea’s physical and biological systems such as a rise in seawater temperature, sea ice melting, alteration of commercial fish migration patterns and the very sudden die-off of certain sea bird species have made front-page news.

Many scientists have been quick to attribute these supposedly ‘unnatural’ events to human-induced atmospheric warming or climate change without mentioning or giving due consideration to emissions from active volcanic features that circumvent the entire Bering Sea and populate its seafloor.

This immediate jump to a climate change cause and event effect relationship is especially difficult to understand knowing that frequently during the last five years we have been informed of yet another eruption from a Bering Sea area volcano located in either Russia, Alaska, or on the Bering seafloor.

So, let’s take a moment to review Bering Sea volcanic activity and its likely effect on the area’s physical and biological systems.

La fraction anthropique de + 0,3°C depuis 1880 est “noyée” dans la variabilité naturelle

by François Gervais, 6 juillet 2019 in LaSynthèse.OnLine


Conférence de M.François GERVAIS, Lauréat du Prix Yvan Peyches de l’Académie des Sciences, (6 Juillet 2019)

La vague de chaleur ayant traversé la France lors de la dernière semaine de Juin 2019 a donné lieu à une prolifération d’âneries proférées par certains médias, ainsi que, malheureusement, par certains hommes politiques. Les mêmes qui refusaient de prendre en compte les records de froid de l’hiver 2018-2019 dans l’hémisphère Nord, le record de surface de la banquise dans l’Antarctique du 21 septembre 2014 et le record de froid près du Pôle Sud (-98°6 C en 2018), en disant « Ne mélangez pas météo et climat » se sont mis frénétiquement à brandir des records de chaleur comme des scalps, oubliant au passage le bon conseil qu’ils donnaient eux-mêmes il y a 6 mois… Cette augmentation de la variabilité des températures, qui revient régulièrement dans l’histoire du climat de la Planète Terre, est un phénomène naturel où l’Homme, monté sur ses ergots, joue un rôle bien plus faible que clamé urbi et orbi par ceux qui s’enrichissent, au sens propre, du « climat de peur » qu’ils génèrent.

Pour nourrir le débat de faits scientifiques, recensés par des études menées par des scientifiques renommés, dont les références sont citées sur chaque slide, nous avons demandé à M. François Gervais, ancien Directeur de l’UMR 6157 du CNRS, et expert reviewer du rapport AR5 du GIEC, l’autorisation de reproduire sur La Synthèse les 52 slides projetées lors d’une Conférence qui eut lieu le 13 décembre 2018 (NDLR).


  1. Pour accéder aux 52 slides, résumant les enjeux de la transition énergétique, merci de cliquer sur le premier lien en bas de page.

  2. Pour accéder à la biographie de M. François Gervais, auteur de plus de 230 publications dans des revues scientifiques à comité de lecture, cliquer sur le deuxième lien en bas de page.

  3. Pour assister à la Conférence du 13 décembre 2018, cliquer sur le lien ci-dessous (durée : 59 minutes) :

PUTTING CLIMATE CHANGE CLAIMS TO THE TEST

by John Christy, June 18, 2019 in GWPF


This is a full transcript of a talk given by Dr John Christy to the GWPF on Wednesday 8th May.

When I grew up in the world of science, science was understood as a method of finding information. You would make a claim or a hypothesis, and then test that claim against independent data. If it failed, you rejected your claim and you went back and started over again. What I’ve found today is that if someone makes a claim about the climate, and someone like me falsifies that claim, rather than rejecting it, that person tends to just yell louder that their claim is right. They don’t look at what the contrary information might say.

OK, so what are we talking about? We’re talking about how the climate responds to the emission of additional greenhouse gases caused by our combustion of fossil fuels. In terms of scale, and this is important, we want to know what the impact is on the climate, of an extra half a unit of forcing amongst total forcings that sum to over 100 units. So we’re trying to figure out what that signal is of an extra 0.5 of a unit.

Here is the most complicated chart I have tonight, and I hope it makes sense:


Scientist Spots High Geothermal Heat Flux In East Greenland – ‘Dramatic Consequences For Ice Basal Melting’

by K. Richard, July 5, 2019 in NoTricksZone


Geothermal heat flux can foment upper mantle temperature anomalies of 800–1000 °C, and these extreme heat intensities have been found to stretch across 500 km of central-east Greenland. This could result in “a significant contribution of ice melt to the ice-drainage system of Greenland” (Artemieva et al., 2019).

Evidence of more than 100,000 formerly or currently active volcanic vents permeate the Earth’s sea floor (Kelley, 2017).

Active volcanoes spew 380°C sulfuric acid and “metal-laden acidic fluids” into the bottom waters of the world ocean on a daily basis. In other words, literal ocean acidification is a natural phenomenon.

The carbon dioxide concentrations present in these acidic floods reach “astounding” levels, dwarfing the potential for us to even begin to appreciate the impact this explosive geothermal activity has on the Earth’s carbon cycle (Kelley, 2017).

SCE INFO : 45,9°C un record en France ?

by SCE-INFO, 3 juillet 2019 in ScienceClimatEnergie


De nombreux médias l’ont annoncé, tout comme le site MétéoFrance : la barre des 45 °C aurait été franchie pour la première fois en France vendredi 28 juin 2019. On a atteint 45,9 °C à Gallargues-le-Montueux, à l’ouest du Gard, à 16 h 20. Ce serait une première en France depuis que l’on fait des mesures de températures. Température exceptionnelle? Sans remettre en cause le réchauffement global de la basse troposphère, ni l’augmentation de la fréquence des vagues de chaleur constatée par le GIEC, certaines remarques doivent être faites concernant ce record de température.

Avant de sombrer dans le catastrophisme, il est important de “garder la tête froide” et de considérer les quelques points suivants :

1. Une telle température a peut-être déjà été atteinte dans le passé proche, mais n’a tout simplement pas été mesurée. N’oubliez pas qu’il n’y avait pas autant de thermomètres il y a cent ans. Par exemple, en 1865, il n’y avait en France que deux observatoires astronomiques effectuant des observations météorologiques quotidiennes (voir ici). Aujourd’hui, les stations météorologiques professionnelles du réseau de Météo-France, appelé réseau Radome, ne sont que de 554 pour le France métropolitaine. Il faudrait évidemment plus de stations pour monitorer les 643 801 km² de territoire. Aujourd’hui, cela fait une station pour 1162 km2.

2. Pendant l’été 1930, une vague de chaleur a traversé la France, comme l’atteste le petit article de journal ci-dessous (Figure 1) retrouvé dans “The Telegraph” (Brisbane). Les températures sont données en Fahrenheit et 122 Fahrenheit correspondent à 50°C. Bien que l’article ne donne pas les détails de la mesure (il faut donc rester prudent) nous voyons que de telles vagues de chaleurs se sont déjà produites dans le passé. Voyez également ce qui s’est passé en 1900, 1911, 1921 et 1934  ici.

THE COST TO SOCIETY OF RADICAL ENVIRONMENTALISM

by Allan M.R. MacRae, B.A.Sc., M.Eng, July 4, 2019 in WUWT


9. Conclusion

Radical green extremists have cost society trillions of dollars and many millions of lives. Banning DDT and radical green opposition to golden rice blinded and killed tens of millions of children.

Green energy and CO2 abatement schemes, driven by false fears of catastrophic global warming, have severely damaged the environment and have squandered trillions of dollars of scarce global resources that should have been allocated to serve the real, immediate needs of humanity. Properly allocated, these wasted funds might have ended malaria and world hunger.

The number of shattered lives caused by radical-green activism rivals the death tolls of the great killers of the 20th Century – Stalin, Hitler and Mao – radical greens advocate similar extreme-left totalitarian policies and are indifferent to their resulting environmental damage and human suffering… … and if unchecked, radical environmentalism will cost us our freedom.

A Critique of the Fourth National Climate Assessment

by Robert W. Endlich, December 18, 2018 in CAtmSciForum


In describing the errors in the Fourth National Climate Assessment, ‘NCA4’, I’ll use the words from the Executive Summary which purport to link climate changes in the USA to global climate change.

The first claim, “The last few years have also seen record-breaking, climate-related weather extremes,“ is shown to be false, simply by examining climate records, some from the National Climate Data Center.

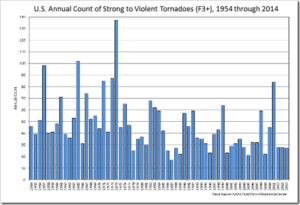
Tornadoes have been decreasing over the past six decades as temperatures moderate from the significant cooling of the 1940s to 1970s.  As a basic knowledge of meteorology teaches, it is the pole to equator temperature difference that drives the intensity of cold season storms and especially the spring-season storms which bring the extremely strong tornado outbreaks.

Figure 1.  Annual count of strong to violent tornadoes from 1954-2014, showing a significant decrease of tornado activity the past 60 years, based on data from NOAAs Storm Prediction Center. [Note: This graphic replaces the original graphic that showed all tornadoes EF1 and stronger. Correction made 1/25/2019].

Record High Temperatures in France: 3 Facts the Media Don’t Tell You

by Roy Spencer, July 2, 2019 in GlobalWarming


News reporting of the recent heat wave in France and other European countries was accompanied with the usual blame on humans for causing the event. For example, here’s the CBS News headline: Record-breaking heat is scorching France. Experts say climate change is to blame.

While it is possible that the human component of recent warming might have made the heat wave slightly worse, there are three facts the media routinely ignore when reporting on such “record hot” events. If these facts were to be mentioned, few people with the ability to think for themselves would conclude that our greenhouse gas emissions had much of an impact.

1. Record High Temperatures Occur Even Without Global Warming

Fermeture ou prolongation de la durée de vie des centrales nucléaires : quelles conséquences économiques et environnementales ?

by Prof.  Ernest Mund, 25 juin 2019 in ScienceClimatEnergie


A la façon dont vont les choses il paraît de plus en plus certain que la Belgique mettra la clé sous le paillasson de son parc de centrales nucléaires en 2025, conformément à la décision de la loi Deleuze votée en 2003. Cet abandon très néfaste est la conséquence du manque de discernement de la part des Autorités politiques au pouvoir face à l’hostilité irréductible du mouvement écologiste à l’égard du nucléaire.

Que cet abandon soit très néfaste est argumenté avec énormément de détails dans un rapport récent de l’IEA (Agence Internationale de l’Energie) dont plusieurs éléments chiffrés sont utilisés dans cette note [1]. Ce rapport analyse avec grande acuité le déclin du nucléaire en service, conçu au cours des années 70. A cette époque le système électrique était centralisé avec une intégration verticale de ses différentes composantes et le prix de l’électricité était le reflet des coûts, indépendamment de toute considération relative à une logique de marché. La taille des installations visait à la réduction des coûts par effet d’échelle. Ce nucléaire (de Génération-II et -III) est devenu totalement inadapté au système décentralisé actuel, alimenté pour une part rapidement croissante en sources d’énergie renouvelable intermittentes (EnRI, éolien et solaire) avec un prix de l’électricité relevant d’un marché, institué dans le courant des années 90.

Truth(?) in testimony and convincing policy makers

by Judith Curry , June 28, 2019 in WUWT


Some reflections, stimulated by yesterday’s Congressional Hearing, on the different strategies of presenting Congressional testimony.

Yesterday’s Hearing provided an ‘interesting’ contrast in approaches to presenting testimony, when comparing my testimony with Michael Mann’s.

What are the purposes of expert testimony?

There is an interesting document entitled A Guide to Expert Testimony for Climate Scientists, funded by the US National Science Foundation.  Most of this is related to court room hearings, but some is relevant for Congressional Hearings.  Excerpts:


Experts may do one or more of the following:

  • Provide the decision-maker with factual information and background to provide the decision-maker with an adequate context for the decision.
  • Apply expert knowledge to the facts of a case and render an opinion about the facts, such as whether certain conditions actually caused an effect.
  • Explain scientific principles and theories to the decision-maker.
  • Extrapolate from the actual facts or hypothetical facts and rendering an opinion regarding the likelihood of an event or occurrence. Experts may speculate on events or occurrences because of their special knowledge or training.
  • Provide an opinion that contradicts or undermines the opinions or conclusions of an expert who testified for the opposing party.

If you are assigned to cross-examine an expert, you should prepare questions that test and challenge the witness on the following subjects :

  • Lack of thoroughness in investigating the facts or data;

  • Insufficient testing of the facts or data;

  • Lack of validity and reliability in testing of facts or data;

  • Existence of other causes or explanations for conclusions or outcomes;

  • Show differences of opinion among experts

Adjusted “Unadjusted” Data: NASA Uses The “Magic Wand Of Fudging”, Produces Warming Where There Never Was

by P. Gosselin, June 25, 2019 in NoTricksZone


By Kirye
and Pierre Gosselin

It’s been long known that NASA GISS has been going through its historical temperature data archives and erasing old temperature measurements and replacing them with new, made up figures without any real legitimate reason.

This practice has led to the formation of new datasets called “adjusted” data, with the old datasets being called “V3 unadjusted”. The problem for global warming activists, however, was that when anyone looks at the old “V3 unadjusted” – i.e. untampered data – they often found a downward linear temperature trend. Such negative trends of course are an embarrassment for global warming alarmists, who have been claiming the planet is warming up rapidly.

The adjusted “unadjusted” data

So what to do? Well, it seems that NASA has decided to adjust its “V3 unadjusted datasets” and rename them as “V4 unadjusted”. That’s right, the adjusted data has become the new V4 “unadjusted” data.

And what kind of trend does the new “V4 unadjusted” data show?

You guessed it. The new V4 unadjusted data are now yielding warmed up trends, even at places where a cooling trend once existed.

This is how NASA uses its magic wand of fudging to turn past cooling into (fake) warming.

6 examples of scandalous mischief by NASA

What follows are 6 examples, scattered across the globe and going back decades, which demonstrate this scandalous mischief taking place at NASA.

No. 1

Punta Arenas, Chile. Here we see how a clear cooling trend has been warmed up by NASA to produce a slight cooling trend:


giss.nasa.gov/cgi-bin/gistemp/stdata_show_v3

giss.nasa.gov/cgi-bin/gistemp/stdata_show_v4

Sky Abandon Facts In Favour Of Climate Propaganda

by P. Homewood, June 25, 2019 in NotaLotofPeopleKnowThat


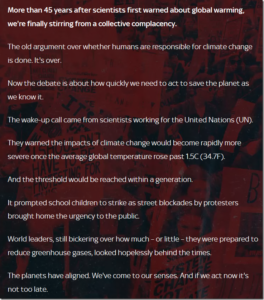
As far as climate change is concerned, Sky News have now abandoned all pretensions to factual accuracy, in favour of blatant propaganda.

They have a new 12-minute special report, to set off a week of special reports, but if this trailer is anything to go by it’s going to be the same old garbage the BBC have served up for years:

The use of the word “storms” in the link title, along with the phrase “climate crisis” gives a good idea of the junk that is to follow.

Let’s go through the trailer’s claims and statements:

Climate science’s ‘masking bias’ problem

by Judith Curry, June 22, 2019 in WUWT


How valid conclusions often lay hidden within research reports, masked by plausible but unjustified conclusions reached in those reports.  And how the IPCC institutionalizes such masking errors in climate science.

In the previous post, we discussed the motivated biases of individual climate researchers, stimulated by the paper by Lee Jussim, Joe Duarte and others entitled Interpretations and methods: Towards a more self-correcting social psychology

The Jussim et al. paper provides additional insights that are relevant to the motivated biases in climate change, which become particularly serious and problematic once these biases are institutionalized. Here are additional excerpts from Jussim et al. for the topic I would like to discuss in this post:

<begin quotes>

“In this paper, we consider how valid conclusions often lay hidden within research reports, masked by plausible but unjustified conclusions reached in those reports. These conclusions do not necessarily involve the use of questionable research practices. Invalid conclusions may be reached based, not on failing to report dropped conditions, failed studies, or nonsignificant analyses, but on selective interpretations of data that highlight researchers’ preferred conclusions while masking more valid ones.”

JC comment: This is basically the problem that I have with the IPCC assessment reports. Deep in the chapters, there is much good information that is reliable, although the reports relatively ignore some topics. The problem is with the conclusions that are reached (particularly in the Summary for Policy Makers), and inflated levels of confidence that are ascribed to these conclusions.