Archives par mot-clé : Fun?/Discussion

L’aluminium, symbole du désarroi climatique ? Pas pour tous….

by Prof. Samuel Furfari, 16 mai 2019, in ScienceClimatEnergie


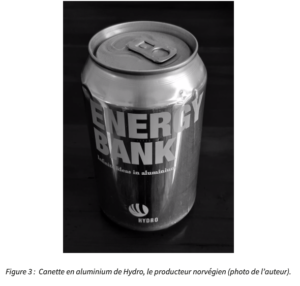
La Commission européenne a publié dès le début de l’année 2019 son rapport sur l’évolution des prix et coûts de l’énergie en Europe.  On peut y lire que l’étude de ces coûts devrait conduire à  « veiller à̀ ce que les entreprises ne soient pas désavantagées ni écartées » et que « les prix de détail (réels) dans l’Union sont plus élevés qu’aux États-Unis, au Canada, en Russie, en Chine et en Turquie, mais inférieurs à̀ ceux observés au Japon et au Brésil. » Le graphique suivant (Figure 1) illustre bien le fait que les industries européennes sont pénalisées par rapport aux entreprises d’autres pays qui sont des concurrents directs sur les marchés internationaux, y compris pour nos importations. Le rapport ajoute pudiquement, sans y insister que « l’évolution des prix de l’électricité est dominée par les taxes et prélèvements ».

‘Gimme Gimme Shock Treatment’

by Joe Bastardi, May 17, 2019 inThePatriotPost


Apparently, the new strategy to fight climate change is shock therapy. It’s like today’s environmental crusaders are channeling the Ramones song “Gimme Gimme Shock Treatment.” Here are some illustrations.

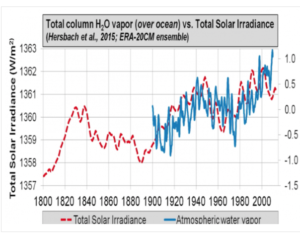
Shock treatment is for extreme measures. But take, for example, this Dr. Willie Soon plot of solar irradiance (a measure of solar energy) vs. water vapor:

Water vapor is the number-one greenhouse gas. So it’s no secret what temperatures do when water vapor increases.

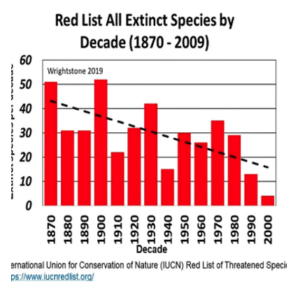
Recent Studies Indicate Species Extinctions Decline With Warming – Mass Extinction Events Due To COOLING

by K. Richard, May 16, 2019 in NoTricksZone


In the past it has been widely reported that high and abruptly changing CO2 concentrations led to climate conditions that were “too hot for complex life to survive” on the planet.
More recently, though, scientists have determined that the opposite may have been true: mass extinction events occurred during periods of global cooling, expansive ice sheet growth, and marine-habitat-destroying sea level drops of more than 100 meters.
In fact, of the 5 previous mass extinctions, volcanism-induced glaciation is thought to be responsible for the 1st, 3rd, and 4th events, with the 2nd unknown and the 5th from an aseteroid impact.  None of these explanations have ties to CO2 concentrations or sudden warming.

Image Sources: Loehle & Eschenbach (2012), BBC, Wrightstone, 2019

Solutions au réchauffement climatique : des universitaires de Cambridge tentent de trouver un moyen de re-geler l’Arctique

by F. Gervais, 15 mai 2018, in Atlantico


Atlantico : Quelles solutions envisagées par la communauté scientifique sont aujourd’hui les plus plausibles pour infléchir réellement le réchauffement climatique ? Pour l’inverser ?

François Gervais : La température moyenne de la Planète a augmenté de l’ordre de 1°C depuis le début du siècle dernier. Mais selon les données du Hadley Center britannique (HADCRUT4), 60 % de cette hausse s’est produite de 1910 à 1945 alors que les émissions de CO2 étaient 6 à 10 fois inférieures à ce qu’elles sont de nos jours, plaidant pour une cause principalement naturelle. Durant les 74 années suivantes, la température n’a augmenté que de 0,4°C en dépit de l’accélération des émissions à partir de 1945. Ce ne sont donc pas les observations qui sont inquiétantes mais les projections des modèles de climat repris par le GIEC. Leur problème est toutefois qu’ils ne sont pas d’accord entre eux, prévoyant des hausses avec une incertitude dans un rapport de 1 à 3, incertitude qui ne s’est pas réduite en 40 ans d’études en dépit de moyens considérables. Un corpus de 3000 publications dans des revues internationales conclut en revanche à une prééminence de la variabilité naturelle du climat sur la contribution anthropique. Cela dit, réduire notre addiction au carbone est sans doute sage car les ressources ne sont pas inépuisables. Mais jouer aux apprentis sorciers avec la géo-ingénierie est plus discutable. Et à quoi bon puisque des astronomes prévoient une moindre activité solaire dans les années à venir. Les recherches visant à retransformer le CO2 en carburant à partir de la photosynthèse de micro-algues sont intéressantes, surtout si le prix du baril devait considérablement augmenter à l’avenir. Toutefois, le supplément de CO2dans l’atmosphère a enrichi la biomasse végétale de l’ordre de 20 % comme le vérifie le verdissement de la Planète observé par satellite. Serait-il raisonnable d’en contrarier le bénéfice en particulier pour les plantes nutritives ?

German Employer’s Association Op Ed: “No Expert Politician In Berlin Believes In Switch To Green Energies Any More”

by P. Gosselin, May 14, 2019 in NoTricksZone


As the pressure mounts in Germany to switch off coal power plants and to rapidly transition over to green energies, one gets the feeling that it all has more to do with a desperate, last-ditch effort by the green energy proponents to rescue their pet green project.

Behind closed doors, no one in Berlin believes in it

Now, just days ago, energy expert Dr. Björn Peters wrote at the German Association of Employers site that the Energiewende has deteriorated to the point that: “No specialist politician in Berlin believes in the success of the Energiewende any more. Whoever you ask, everyone says this only behind closed doors and thinks that if you go to the press with it you can only lose against the ‘green’ media mainstream.”

Peters warns that what is needed in Germany is a good dose of reality and “a fresh start on energy policy.”

Advantages of fossil fuels “too great”

The German expert writes that despite the hundreds of billions of euros committed to green energies, “chemical energy from coal, oil and gas supplies about four fifths of primary energy worldwide and also in Germany and thus represents the present energy supply”.

UN Biodiversity Officials Fail Transparency Test

by Donna Laframboise, May 13, 2019 in BigPictureNews


The United Nations Intergovernmental Science-Policy Platform on Biodiversity and Ecosystem Services (IPBES) is a clone of the IPCC, the UN’s climate body. But there are some notable differences.

We’re told that a great deal of power resides with the Multidisciplinary Expert Panel (MEP), which currently consists of 28 individuals. These are the people who, for example, decide which international scholars will be assigned to discuss which topics within the pages of official IPBES reports.

To its credit, that entity’s website has been designed to provide the CV of everyone who sits on this panel. Rather than taking the UN’s word for it that these are world class experts, the public is given the opportunity to examine their credentials firsthand.

But saying you believe in transparency is different from acting like it. If organizations aren’t living up to the standards they’ve set for themselves, that’s worth noticing.

Last week was hugely important for the IPBES – it sought and received massive international media coverage. Despite this, it utterly failed its own transparency test. The CVs of most MEP members aren’t actually available online.

Climate data shows no recent warming in Antarctica, instead a slight cooling

by Anthony Watts, May 10, 2019 in WUWT


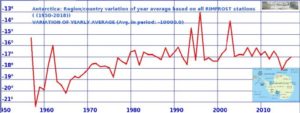
Below is a plot from a resource we have not used before on WUWT, “RIMFROST“. It depicts the average temperatures for all weather stations in Antarctica. Note that there is some recent cooling in contrast to a steady warming since about 1959.


Data and plot provided by
http://rimfrost.no 

Contrast that with claims by Michael Mann, Eric Steig, and others who used statistical tricks to make Antarctica warm up. Fortunately, it wasn’t just falsified by climate skeptics, but rebutted in peer review too.

The UN’s Extinction Warning Doesn’t Add Up (Except On The BBC)

by Toby Young, May 9, 2019 in ClimateChangeDispatch


Anyone watching the BBC’s News at Ten on Monday would have been surprised to learn that economic growth poses a dire threat to the future of life on this planet.

We’re used to hearing this from climate change campaigners, but I’ve always taken such claims with a pinch of salt, suspecting that the anti-capitalist left is distorting the evidence. Apparently not.

‘One million species at risk of imminent extinction according to a major UN report,’ intoned the BBC. ‘It says the Earth’s ecosystems are being destroyed by the relentless pursuit of economic growth.’

So does this mean the Extinction Rebellion protestors are right?

I decided to do some digging to see if one million species really do ‘face extinction in the next few decades’, as the BBC put it.

That claim is based on a report by the UN’s Intergovernmental Science-Policy Platform on Biodiversity and Ecosystem Services (IPBES), but it hasn’t been published yet.

Does NASA’s Latest Figures Confirm Global Warming?

by Anthony Watts, May 9, 2019 in ClimateChangeDispatch


That’s an indication of the personal bias of co-author Schmidt, who in the past has repeatedly maligned the UAH dataset and its authors because their findings didn’t agree with his own GISTEMP dataset.

In fact, Schmidt’s bias was so strong that when invited to appear on national television to discuss warming trends, in a fit of spite, he refused to appear at the same time as the co-author of the UAH dataset, Dr. Roy Spencer.

A breakdown of several climate datasets, appearing below in degrees centigrade per decade, indicates there are significant discrepancies in estimated climate trends:

  • AIRS: +0.24 (from the 2019 Susskind et al. study)
  • GISTEMP: +0.22
  • ECMWF: +0.20
  • RSS LT: +0.20
  • Cowtan & Way: +0.19
  • UAH LT: +0.18
  • HadCRUT4: +0.17

Which climate dataset is the right one? Interestingly, the HadCRUT4 dataset, which is managed by a team in the United Kingdom, uses most of the same data GISTEMP uses from the National Oceanic and Atmospheric Administration’s Global Historical Climate Network.

Nature crisis: Humans ‘threaten 1m species with extinction’-BBC

by P. Homewood, May 7, 2019 in NotaLotofPeopleKnowThat


The BBC has just reported on the newly published Summary for Policy Makers of the as yet unpublished UN 1800 page global assessment of nature compiled by the Intergovernmental Science-Policy Platform on Biodiversity and Ecosystem Services (IPBES). The two day old ‘climate crisis’, so recently [not] declared by the British government has already been knocked off the top spot as far as existential crises are concerned and is now officially languishing in 3rd place, in the Second Division. Land use change is now Premier Division. However, unlike action on the ‘climate crisis’, which has become a $1.5 trillion industry, action on land use change has been negligible to non-existent. Even hunting (legal and non-legal) and the direct exploitation of wildlife is one division above climate change in terms of the threat to biodiversity. Bugger all has been done to address these threats too, relatively speaking, during the last three decades, whereas trillions has been thrown at ineffective, and socially, economically and environmentally damaging attempts to limit global warming to 2C (and latterly 1.5C). I warned about this 3 years ago.

How much has urbanisation affected United Kingdom temperatures?

by P. Homewood, May 6, 2019 in NotaLotofPeopleKnowThat


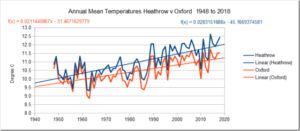
This study aims to estimate the affect of urbanisation on daily maximum and minimum temperatures in the United Kingdom. Urban fractions were calculated for 10 km × 10 km areas surrounding meteorological weather stations. Using robust regression a linear relationship between urban fraction and temperature difference between station measurements and ERA‐Interim reanalysis temperatures was estimated. For an urban fraction of 1.0, the daily minimum 2‐m temperature was estimated to increase by 1.90 ± 0.88 K while the daily maximum temperature was not significantly affected by urbanisation. This result was then applied to the whole United Kingdom with a maximum T min urban heat island intensity (UHII) of about 1.7K in London and with many UK cities having T min UHIIs above one degree.

This paper finds through the method of observation minus reanalysis that urbanisation has significantly increased the daily minimum 2‐m temperature in the United Kingdom by up to 1.70 K.

https://rmets.onlinelibrary.wiley.com/doi/full/10.1002/asl.896

As ever, the real issue with UHI is the change in the effect over time. Has, for instance, the effect of UHI increased in London and other cities increased over the last century, or was it just as great in 1919?

What we do know is that, generally speaking, towns and cities have both expanded over time, and seen increasing development in terms of roads, buildings, traffic and economic activity.

Indeed, these same tendencies also apply in small towns and what may appear to be relatively rural sites.

We also know that many of the sites used by the Met Office in their UK temperature series are urban and airport locations.

https://www.metoffice.gov.uk/public/weather/climate-historic/#?tab=climateHistoric

Quote of the Week: Greta Thunberg claims to be able to “see” carbon dioxide in the air

by Anthony Watts, May 2, 2019 in WUWT


At first, I thought this had to be a joke. Then I thought it must be some sort of misinterpretation. Sadly, no.

From the website Afrinik, quoting the book –Scener ur hjärtat by Malena Ernman, Svante Thunberg:

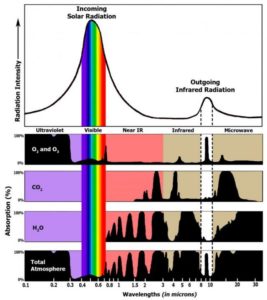
Of course, with a ~ 410 parts per million concentration of CO2 in the atmosphere, we know that is a physical impossibility. Carbon Dioxide is a colorless and odorless gas:


Source:
http://www.ces.fau.edu/nasa/module-2/how-greenhouse-effect-works.php

Big Oil goes Big Green

by David Wojick, May 4, 2019 in WUWT


Climate alarmists often accuse skeptics, like myself and independent groups like the Committee For A Constructive Tomorrow and Heartland Institute, of being in the pay of Big Oil. This is completely false – the Big Lie repeated so often that people eventually believe it. We do not receive even a dime from Big Oil. It’s part of the green fairy tale that skepticism exists only because the oil companies are funding it.

For the record, none of us skeptics – climate realists – doubt or deny climate change. We all recognize that Earth’s climate is in nearly constant turmoil and fluctuation, locally, regionally or globally.

What we question is assertions that emissions from fossil fuel use have somehow replaced the sun and other powerful natural forces that have driven beneficial, benign, harmful or even hugely destructive climate changes throughout Earth and human history:

Changes such as at least five glacial periods that buried much of North America, Europe and Asia under mile-high rivers of ice, warm periods in between that melted those massive glaciers, Roman and Medieval Warm Periods, a Little Ice Age, the century-long Anasazi and Mayan droughts, the Dust Bowl, and countless other major and minor climate and weather changes.

The standard refrain is that ExxonMobil gave a cumulative few million dollars to various skeptical groups prior to 2007. But that was many years ago. They got scared off by alarmist pressure groups and haven’t given climate realists a dime since then. In fact, the situation today is completely the opposite.

Big Oil companies now give at least a billion dollars a year to climate alarmists, projects and lobbying, to drive the Manmade Climate Chaos narrative. Why would they do that? Two reasons come to mind.

BIG NEWS – Verified by NOAA – poor weather station siting leads to artificial long term warming

by Anthony Watts, May 3, 2019 in WUWT


I’ve been saying for years that surface temperature measurements (and long term trends) have been affected by encroachment of urbanization on the placement of weather stations used to measure surface air temperature, and track long term climate. In doing so we found some hilariously bad examples of climate science in action, such as the official USHCN climate monitoring station at the University of Arizona, Tucson:


USHCN weather station in a parking lot. University of Arizona, Tucson

I have published on the topic in the scientific literature, and found this to be true based on the science we’ve done of examining the USHCN and applying the siting methodology of Leroy 2010.

In Fall et al, 2011 we discovered that there was a change to the diurnal temperature range (DTR). It decreased where stations had been encroached upon, because of the heat sink effect of man-made materials (asphalt, concrete, bricks, etc.) that were near stations.

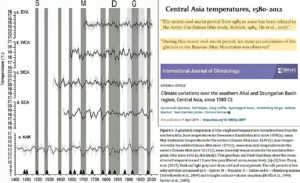
A New Temperature Reconstruction From Central Asia Shows 432 Years Of No Warming, Recent Cooling By Kenneth Richard on 2. May 2019

by K. Richard, May 2, 2019 in NoTricksZone


Tree-ring evidence reveals recent cooling and glacier thickening in Central Asia as well as flat temperatures throughout the last 432 years.

Tree rings were the proxy used by Dr. Michael Mann to invent the orignal hockey stick graph.

Twenty years later, yet another reconstruction (1580 to 2012 AD) indicates modern warmth in Central Asia is not unusual in the context of the last 432 years.

In fact, there was a recent cooling period, in line with natural variability, that was accompanied by regional glacier mass gains.

Byambaa et al., 2019

Le GIEC au pays des merveilles

by Drieu Godefridi, 2 mai 2019 in Contrepoints


Réduire le réchauffement global sur Terre de 1,5° ? Dans un récent rapport, le Giec échafaude quatre scénarios pour y parvenir. Mais aucun d’eux ne tient la route.

es quatre scénarios mettent en œuvre à des degrés divers les techniques dites de Carbon Dioxide Removal (CDR), qui compensent les émissions humaines de CO2. Écoutons les experts « scientifiques » du GIEC — dont la plupart ne sont pas scientifiques. Lisons les experts du GIEC :

GWPF STATEMENT ON THE PROPOSED NET ZERO 2050 EMISSIONS TARGET

by GWPF, May 2, 2019


Summary

The recommendation of the Committee on Climate Change (CCC) for a Net Zero emissions target by 2050 is grounded in nothing stronger than irresponsible optimism and arbitrary assumptions about cost and technological feasibility. In point of fact, the technologies seen as necessary, including carbon capture and sequestration (CCS), further expansion of renewable generation, widespread adoption of hydrogen, and the very rapid electrification of the UK’s entire heating and transport systems, are either known failures or are unproven at these scales and would cost two to three times the amounts claimed by the CCC. Attempts to deliver these policies would ultimately fail, but in the attempt the UK would further harm its already declining productivity, and so erode the UK’s ability to compete internationally and thus deliver an acceptable standard of living for its people. This is not a sustainable low emissions strategy, and even if accepted by government is very likely to end only in humiliating and distressed policy correction. A wise government would reject this advice.
The Net Zero target and the recent history of emissions reductions in the UK

A Story of CO2 Data Manipulation

by Tim Ball in A. Watts, May 1, 2019 in WUWT


The consistent pattern of the IPCC reveals demonization and misrepresentations of CO2. Here are some basic facts about CO2 that illustrate the discrepancy between what the IPCC claim and what science knows.

  • Natural levels of Carbon dioxide (CO2) are less than 0.04% of the total atmosphere; it is far from being the most important or even only greenhouse gas as most of the public understands.

  • Water vapour which is 95 percent of the greenhouse gases by volume is by far the most abundant and important greenhouse gas.

  • The other natural greenhouse gas of relevance is methane (CH4), but it is only 0.000175 percent of atmospheric gases and 0,036 percent of all greenhouse gases.

  • In order to amplify the importance of CO2 they created a measure called “climate sensitivity”. This determines that CO2 is more “effective” as a greenhouse gas than water vapour

  • Here is a table from Wikipedia showing estimates of the effectiveness of the various GHGs. Notice the range of estimates, which effectively makes the measures meaningless, unless you have a political agenda. Wikipedia acknowledges “It is not possible to state that a certain gas    causes an exact percentage of the greenhouse effect.”


Analysis of new NASA AIRS study: 80% of U.S. Warming has been at Night

by Dr. Roy Spencer, April 30, 2019 in WUWT


I have previously addressed the NASA study that concluded the AIRS satellite temperatures “verified global warming trends“. The AIRS is an infrared temperature sounding instrument on the NASA Aqua satellite, providing data since late 2002 (over 16 years). All results in that study, and presented here, are based upon infrared measurements alone, with no microwave temperature sounder data being used in these products.

That reported study addressed only the surface “skin” temperature measurements, but the AIRS is also used to retrieve temperature profiles throughout the troposphere and stratosphere — that’s 99.9% of the total mass of the atmosphere.

Since AIRS data are also used to retrieve a 2 meter temperature (the traditional surface air temperature measurement height), I was curious why that wasn’t used instead of the surface skin temperature. Also, AIRS allows me to compare to our UAH tropospheric deep-layer temperature products.

So, I downloaded the entire archive of monthly average AIRS temperature retrievals on a 1 deg. lat/lon grid (85 GB of data). I’ve been analyzing those data over various regions (global, tropical, land, ocean). While there are a lot of interesting results I could show, today I’m going to focus just on the United States.

The Three Sides Of Climate Science

by Hans Schreuder, April 29, 2019 in ClimateChangeDispatch


For the past 30 years, there has been an orchestrated alarm over how much a trace of a trace gas, human-produced carbon dioxide (CO2), impacts earth’s climate.

The idea was presented as the ‘settled science’ and that there exists a ‘greenhouse effect’ in Earth’s atmosphere and that CO2 ‘traps heat’ or ‘delays cooling’.

Besides the ‘official scientists’ who have convinced the world that there really is a problem, there are what I call the pseudo-skeptics, a large group that is more widely known as ‘Lukewarmists’.

They include many professors who don’t disagree that the trace gas CO2 must be causing ‘some’ warming but think it is so small it isn’t worth worrying about.

This group also fully backs the greenhouse gas theory and claims CO2 warming is logarithmic (i.e., determined on a sliding scale of positive water vapor feedback – see this post from WUWT with reader comments and the subsequent confusion).

UAH, RSS, NOAA, UW: Which Satellite Dataset Should We Believe?

by Dr Roy Spencer, April 23, 2019 in GlobalWarming


This post has two related parts. The first has to do with the recently published study of AIRS satellite-based surface skin temperature trends. The second is our response to a rather nasty Twitter comment maligning our UAH global temperature dataset that was a response to that study.

Furthermore, that period (January 2003 through December 2017) shows significant warming even in our UAH lower tropospheric temperature (LT) data, with a trend 0.01 warmer than the “gold standard” HadCRUT4 surface temperature dataset (all deg. C/decade):

AIRS: +0.24
GISTEMP: +0.22
ECMWF: +0.20
Cowtan & Way: +0.19
UAH LT: +0.18
HadCRUT4: +0.17

I’m pretty sure the Susskind et al. paper was meant to prop up Gavin Schmidt’s GISTEMP dataset, which generally shows greater warming trends than the HadCRUT4 dataset that the IPCC tends to favor more. It remains to be seen whether the AIRS skin temperature dataset, with its “clear sky bias”, will be accepted as a way to monitor global temperature trends into the future.

What Satellite Dataset Should We Believe?

The big Arctic Sea-Ice shift of 2007: Ice refuses to melt

by Javier, April 23, 2019 in WUWT


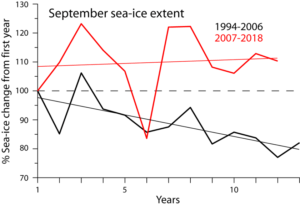
I have maintained since 2015 that in the 2006-2007 season the Arctic underwent a cyclical phase shift, and the rapid sea-ice melting observed over the previous decades ended. A few scientists predicted or explained this shift based on their study of multi-decadal oscillations (see bibliography). They were ignored by mainstream climatology and the press because the “anthropogenic” melting of the Arctic is one of the main selling points of the climate scare. See for example:

Year after year the data supports my view over the desperate scaremongers like Tamino. With the passing of time it is more and more difficult to defend the idea that Arctic melting is continuing, so alarmists keep changing the metric. First it was September sea-ice extent (SIE), then September sea-ice volume, and now annual average SIE. However, the reference measurements are September minimum SIE and March maximum SIE.

This article is more than a biannual update on the Arctic ice situation, as I will focus specifically on showing evidence for the trend change that took place in 2007. As 12 years have passed since the shift, the best way is to compare the 2007-2019 period with the previous 1994-2006 period of equal length to display the striking differences between both periods.

Figure 1. Changes in September SIE for both periods as a percentage change over the first year of the period.

HAPPY EARTH DAY! WHEN WE CELEBRATE EVERY FAILED ALARMIST ECO-PREDICTION

by Nicolas Loris, April 22, 2019 in GWPF/BangorDailyNews


We should be thankful that the gloom-and-doom predictions made throughout the past several decades haven’t come true. Fear-mongering about explosive population growth, food crises and the imminent depletion of natural resources have been a staple of Earth Day events since 1970. And the common thread among them is that they’ve stirred up a lot more emotions than facts.

“By the year 2000, if present trends continue, we will be using up crude oil at such a rate … that there won’t be any more crude oil,” ecologist Kenneth Watt warned around the time of the first Earth Day event. “You’ll drive up to the pump and say, ‘Fill ’er up, buddy,’ and he’ll say, ‘I am very sorry, there isn’t any.’” Watt also warned of global cooling and nitrogen buildup rendering all of the planet’s land unusable.