by W. Eschenbach, July 24, 2020 in WUWT
OK, no need to torture me, I confess it—I’m a data junkie.
And when I see a new (to me at least) high-resolution dataset, my knees get weak. Case in point? The temperature dataset of the Colle Gnifetti ice core. It has a two-year resolution thanks to some new techniques. Better, it stretches clear back to the year 800. And best, it extends up to near the present, 2006. This lets us compare it to modern datasets. The analysis of the ice core dataset is described in Temperature and mineral dust variability recorded in two low-accumulation Alpine ice cores over the last millennium by Pascal Bohleber et al.
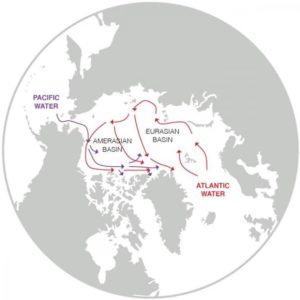
Let me start with where Colle Gnifetti is located. Unusual among ice core records, it’s from Europe, specifically in the Alps on the border of Switzerland and Italy.
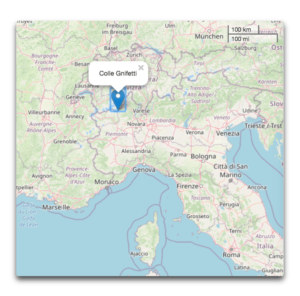
Figure 1. Location of the ice cores in the study.
This is good because some of the longest thermometer-based temperature records are in Europe.
One interesting thing about the site is that usually, ice core drilling occurs at the literal ends of the earth, in Antarctica and Greenland and the like. But this site is not far from the foot of the Margherita Hut, which is at over 4500 metres elevation.
…
…
Further Reading: It’s instructive to compare the listed temperatures with the data in A Chronological Listing of Early Weather Events.