
by K. Richard, August 20, 2018 in NoTricksZone
Archives mensuelles : août 2018
Direct evidence of surface exposed water ice in the lunar polar regions
by Shaui Li et al., August 20, 2018 PNAS
We found direct and definitive evidence for surface-exposed water ice in the lunar polar regions. The abundance and distribution of ice on the Moon are distinct from those on other airless bodies in the inner solar system such as Mercury and Ceres, which may be associated with the unique formation and evolution process of our Moon. These ice deposits might be utilized as an in situ resource in future exploration of the Moon.
…
Integrated genomic and fossil evidence illuminates life’s early evolution and eukaryote origin
by Holly C. Betts et al., August 20, 2018 in NatureEcology&Evolution
We derive a timescale of life, combining a reappraisal of the fossil material with new molecular clock analyses. We find the last universal common ancestor of cellular life to have predated the end of late heavy bombardment (>3.9 billion years ago (Ga)). The crown clades of the two primary divisions of life, Eubacteria and Archaebacteria, emerged much later (<3.4 Ga), relegating the oldest fossil evidence for life to their stem lineages. The Great Oxidation Event significantly predates the origin of modern Cyanobacteria, indicating that oxygenic photosynthesis evolved within the cyanobacterial stem lineage. Modern eukaryotes do not constitute a primary lineage of life and emerged late in Earth’s history (<1.84 Ga), falsifying the hypothesis that the Great Oxidation Event facilitated their radiation…
Observing glaciers in “real time”
by Anthony Watts, August 20, 2018 in WUWT
From ETH Zurich and the “slow as molasses in winter” department.
Hot summers cause glaciers to melt. That not only changes the makeup of the landscape and hence the maps of Switzerland, it also affects every area of society. A new, dynamic glacier inventory makes the impact of climate change and the changing landscape visible.
The last time Swiss glaciers managed to grow at all was in 2001. Since then, the country’s 1,500 glaciers – as well as others elsewhere – have been suffering a slow but inexorable death. Until now, though, we have understood only partially how quickly they are really disappearing, and what effect that has on the landscape, people and animals. That is about to change, thanks to the Glacier Monitoring in Switzerland (GLAMOS) project. GLAMOS is working on behalf of various Swiss federal offices to put together a comprehensive inventory of the country’s glaciers – at an unprecedented level of detail.
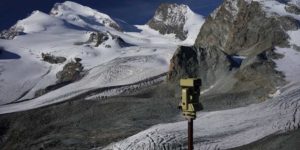
Glacier observation under the spell of several Valais four-thousand-metre peaks. (Photograph: GLAMOS)
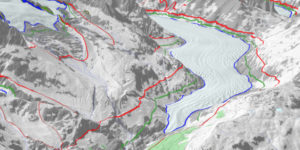
The coloured lines show where the edge of the Aletsch glacier once was (red line 1850, green=1973, blue=2010). (Graphic: Swisstopo/GLAMOS)
America Had Lower CO2 Emissions Than Paris Climate Accord Signatories
by Stephen Moore, August 20, 2018 in ClimateChangeDispatch
Take a wild guess what country is reducing its greenhouse gas emissions the most? Canada? Britain? France? India? Germany? Japan? No, no, no, no, no and no.
The answer to that question is the United States of America. Wow! How can that be? This must be a misprint. Fake news. America never signed the Kyoto Protocol some two decades ago.
…
New Ice-Free Arctic Forecast
by Tony Heller, August 20, 2018 in TheDeporableClimateScienceBolg
Arctic sea ice melt dropped to its lowest level since May 12 yesterday, and now the Arctic won’t be ice-free until July 20 of next year, 12:01 am.
…
Climate4you update July 2018
by Ole Humlum, August 20, 2018 in Climate4You
CONTENTS
July 2018 global surface air temperature overview
Comments to the July 2018 global surface air temperature overview Temperature quality class 1: Lower troposphere temperature from satellites Temperature quality class 2: HadCRUT global surface air temperature Temperature quality class 3: GISS and NCDC global surface air temperature Comparing global surface air temperature and satellite-based temperatures Global air temperature linear trends
Global temperatures: All in one, Quality Class 1, 2 and 3
Global sea surface temperature
Ocean temperature in uppermost 100 m
North Atlantic heat content uppermost 700 m
North Atlantic temperatures 0-800 m depth along 59N, 30-0W
Global ocean temperature 0-1900 m depth summary
Global ocean net temperature change since 2004 at different depths
La Niña and El Niño episodes
Troposphere and stratosphere temperatures from satellites
Zonal lower troposphere temperatures from satellites
Arctic and Antarctic lower troposphere temperatures from satellites Temperature over land versus over oceans
Arctic and Antarctic surface air temperatures
Arctic and Antarctic sea ice
Sea level in general
Global sea level from satellite altimetry
Global sea level from tide gauges
Northern Hemisphere weekly and seasonal snow cover
Atmospheric specific humidity
Atmospheric CO2
The phase relation between atmospheric CO2 and global temperature
Global air temperature and atmospheric CO2
Latest 20-year QC1 global monthly air temperature change
Sunspot activity and QC1 average satellite global air temperature
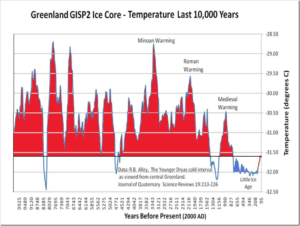
Climate and history: 1728: Vitus Bering and the non-discovery of Bering Strait
The Holocene Climate Optimum
by P. Homewood, August 19, 2018 in NotaLotofPeopleKnowThat
Booker commented the other day how one scientist claimed last week that we now have “the highest temperatures on Earth since the last ice age”. The BBC failed to even challenge this statement.
This certainly is not the first time I have heard claims (presented as fact) to this effect.
We have already seen concerted attempts to disappear the MWP, so it is time to reclaim the Holocene Optimum (so named for good reason), which is generally accepted to have run from about 9000 to 5000 years ago
Obviously we had no thermometers around in those days, so nobody knows what the average temperature of the Earth was then. There again, nobody really knows now either.
But there is plentiful evidence that many places were significantly warmer than now. I present some of this evidence below, though this is probably only skimming the surface: …
See also here
Clean Energy Investment Trends, 2Q 2018
by BloombergNRF, July 9, 2018
…
Wind
Electricity generation using wind turbines. Included in this sector, are players across the entire value chain of both onshore and offshore developments. From manufacturers of turbines, components and subassemblies to developers, generators, utilities and engineering firm.
Solar
All technologies which capture energy directly from the sun. These include production of electricity using semiconductor-based photovoltaic (pv) materials, use of concentrated sunlight to heat fluids that drive power generation equipment (solar thermal), and passive methods which use sunlight to heat water. Whilst company level investment of passive methods is recorded, investment in passive projects is not.
Biofuels
Liquid transportation fuels including biodiesel and bioethanol. These can be derived from a range of biomass sources, including sugar cane, rape seed, soybean oil or non-food cellulosic feedstock. Our database excludes producers of base biomass, but includes suppliers of everything from the processing technologies and equipment, through the logistics of distribution, to manufacturers of energy systems which are specially adapted for the use of biofuels and products, and the services on which they depend.
Biomass & waste
Electricity and/or heat produced with bio-based feedstocks, typically through incineration but also through more advanced processes like gasification or anaerobic digestion. This sector also includes waste-to-energy which includes energy produced through landfill gas projects and incineration of municipal and industrial waste.
Energy smart technologies
This sector covers technologies like digital energy, smart grids, power storage, hydrogen and fuel cells, advanced transportation and energy efficiency on both the demand and supply side.
Other renewables
Includes small hydro – hydro projects with capacities smaller or equal to 50MW; geothermal – extraction of useful power from heat stored in the earth; marine – the extraction of tidal, wave and thermal energy from the ocean.
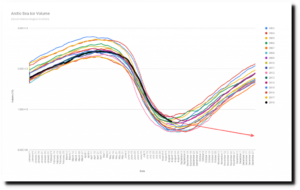
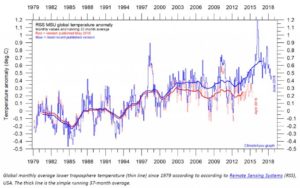
RSS Suspected Of “Serious Data Doping”, German Scientists Say…”Values Fudged To Fit Models”!
by Dr. S. Lüning and Prof. F. Vahrenholt, August 19, 2018 in NoTricksZone
Temperatures can be measured from the ground and from satellites. Satellite data have two versions, UAH and RSS. The version of UAH (University of Alabama, Huntsville) makes a solid impression. The RSS version shows larger deviations and suggests a stronger warming.
How come?
Doping the data
Both datasets surely get their data from similar satellites. The explanation lies in a “post-processing” of the measured values by the RSS group. In the chart below you can see the old version in red.
Global temperature based on RSS satellite measurements. From Climate4You Newsletter June 2018.
…
Weather and Climate in the Real World
by Tim Ball, August 18, 2018 in WUWT
…
All the trillions of dollars spent on AGW have not improved forecasting one bit. Instead, it diverted money that could have helped those large, primary sectors of society and economy that need better and more appropriate information. It is time to close all government weather offices or at least reduce their function to data collection determined by the end users.
…
Aussie PM Humiliating Backdown on Paris Agreement Pledges
by Eric Worrall, August 18, 2018 in WUWT
With the growing likelihood of an open party revolt and a leadership challenge, Australian Prime Minister Malcolm Turnbull has been forced into a humiliating backdown over his efforts to enshrine Australia’s Paris Agreement pledges into legislation.
…
Sécheresses (Grandes), étés caniculaires à travers les siècles
by La France Pittoresque, 1 août 2013
Quel est le degré de température de nos grands étés ? Ici revient l’insurmontable difficulté de fixer au juste, avant l’usage du thermomètre, l’intensité du froid ou de la chaleur. Un artifice fondé sur les rapports reconnus entre certains phénomènes naturels et les mouvements du thermomètre, fournit les mesures approximatives de nos grandes chaleurs et sécheresses.
De Humboldt a posé en principe que la végétation des arbres exige au moins une température moyenne égale à 11°. Le chiffre de cette température répond encore au point où la chaleur de l’air commence à devenir sensible. Ce degré assez fixe peut être pris pour le premier terme d’une échelle de nos grandes chaleurs. Messier a quant à lui constaté que le maximum de la chaleur à Paris, le 8 juillet 1793, a marqué 40°. C’est à peu près la plus haute température, excepté celle de l’été 1705 à Montpellier, observée en France, le thermomètre au nord, isolé, à l’ombre, à l’abri des réverbérations et à l’air libre.
* VIe siècle : 580, 582, 584, 585, 586, 587, 589, 591
DATES DE NOS GRANDS ÉTÉS ET GRANDES SÉCHERESSES :
* VIIe siècle : 675, 700
* VIIIe siècle : 783
* IXe siècle : 874, 892
* Xe siècle : 921, 987, 994
* XIe siècle : 1078, 1094
* XIIe siècle : 1137, 1183, 1188
* XIIIe siècle : 1204, 1212, 1226, 1287
* XIVe siècle : 1305, 1306, 1325, 1331, 1334, 1361, 1384, 1392
* XVe siècle : 1473
* XVIe siècle : 1540, 1553
* XVIIe siècle : 1632, 1674, 1684, 1694
* XVIIIe siècle : 1701, 1712, 1718, 1719, 1726, 1727, 1767, 1778, 1793
* XIXe siècle : 1803, 1811, 1817, 1825, 1842, 1858, 1875, 1893
…
Drought Proofing a Dry Continent
by Viv Forbes, August 16, 2018 in WUWT
…
Sensible drought-proofing policies for Australia are simple –
- Stop wasting water
- Build more dams, pipelines and pumps
- Build power stations capable of delivering cheap reliable electricity for pumping water and energising desalination plants.
To view this whole article plus images click:
http://carbon-sense.com/wp-content/uploads/2018/08/build-more-dams.pdf
Chemical nature of the 3.4 Ga Strelley Pool microfossils
by J. Allen et al., 2018 in GeochemicalPerspectiveLetters
The biogenicity of putative traces of life found in early-Archean rocks is strongly debated. To date, only equivocal lines of evidence have been reported, which has prevented a full consensus from emerging. Here we report elemental and molecular data from individual organic microfossils preserved within the 3.4 billion-year-old cherts of the Strelley Pool Formation, Western Australia. The present results support the growing body of evidence advocating their biogenicity, promoting them as the oldest known authentic organic microfossils. These microfossils consist of nitrogen- and oxygen- rich organic molecules that have been only slightly degraded despite experiencing temperatures of ~300 °C. Such molecular preservation emphasises the palaeobiological potential of the Earth’s oldest geological record, whilst providing a promising window into the early biosphere.
…
See also here
Remember when they told us coral bleaching was a sure result of recent man-made global warming? Never mind.
by Anthony Watts, August 17, 2018 in WUWT
From the “science eventually self-corrects” department, new science showing coral bleaching of the Great Barrier Reef is a centuries-old problem, well before “climate change” became a buzzword and rising CO2 levels were blamed.
Marc Hendrickx writes:
New paper shows coral bleaching in GBR extending back 400+ years.
…
A Warm Period by Any Other Name – The Climatic Optimum
by Tim Ball, July 31, 2016 in WUWT
Hypsithermal, Altithermal, Holocene Optimum, Holocene Thermal Maximum, Holocene Megathermal, Anthropogene;
There is frustration and reward when an article appears on the same topic of an article you are completing – in this case the Holocene. Such was the case this week with Andy May’s article “A Review of temperature reconstructions.” Andy points out the basic problems of reconstruction using proxy data for the most recent half of the Holocene – an issue central to historical climate and climate change studies. His paper did not alter my paper except as it reinforces some arguments.
This article examines the entire Holocene and illustrates the history that influenced the studies. There are two distinct parts to the studies, the pre and post Intergovernmental Panel on Climate Change (IPCC). The former is a genuine scientific struggle with issues of terminology and reconstruction, and the latter a scientific struggle to impose a political perspective regardless of the evidence. Because of the damage done to climatology by the proponents of anthropogenic global warming (AGW), both parts require explanation.
…
Japan’s JMA Claim Of “Relatively Small” Urbanization Effect Likely An Understatement Of Multiple Degrees
by Kirye and P. Gosselin, August 17, 2018 in NoTricksZone/JapanMeteorologicalAgency
Aerial photos show that the 15 temperature observation stations the JMA is using to determine mean temperature anomalies are likely impacted far more by urbanization than the agency claims.
…
…
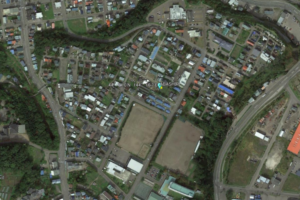
Abashiri is in the middle of buildings and streets.
Why does climate sensitivity increase over time in models? A look at two possibilities
by A. Zaragoza Comendador, August 16, 2018 in WUWT
Note: if the terms used in this article seem confusing, check out the previous one.
Introduction
It’s well known that climate models show increasing sensitivity over time: for a given forcing, the true long-term temperature increase (ECS) is higher than what you’d estimate if you simply extrapolated from the past (ECS_hist). In other words, the ECS-to-ECS_hist ratio is above 1. This article tries to work out why climate models behave like that; that is to say, the variable I’m trying to explain is the ECS-to-ECS_hist ratio.
Now, there’s probably too many hyphens and underscores in the text. So it will be more readable if I clarify that, every time I talk simply about ‘correlation’, I mean the correlation of thing X with the ECS-to-ECS_hist ratio. If other kind of correlation is mentioned, I’ll say so explicitly.
…
A new volcanic province: an inventory of subglacial volcanoes in West Antarctica
by M. Van Wyk De Vries et al., August 16, 2018 in Geol.Soc.London
Abstract: The West Antarctic Ice Sheet overlies the West Antarctic Rift System about which, due to the comprehensive ice cover, we have only limited and sporadic knowledge of volcanic activity and its extent. Improving our understanding of subglacial volcanic activity across the province is important both for helping to constrain how volcanism and rifting may have influenced ice-sheet growth and decay over previous glacial cycles, and in light of concerns over whether enhanced geo- thermal heat fluxes and subglacial melting may contribute to instability of the West Antarctic Ice Sheet. Here, we use ice-sheet bed-elevation data to locate individual conical edifices protruding upwards into the ice across West Antarctica, and we propose that these edifices represent subglacial volcanoes. We used aeromagnetic, aerogravity, satellite imagery and databases of confirmed volca- noes to support this interpretation. The overall result presented here constitutes a first inventory of West Antarctica’s subglacial volcanism. We identified 138 volcanoes, 91 of which have not previously been identified, and which are widely distributed throughout the deep basins of West Antartica, but are especially concentrated and orientated along the >3000 km central axis of the West Antarctic Rift System.
The intensification of the water footprint of hydraulic fracturing
by A.J. Kondash et al., August 15, 2018 in ScienceAdvances
Abstract
Unconventional oil and gas exploration in the United States has experienced a period of rapid growth, followed by several years of limited production due to falling and low natural gas and oil prices. Throughout this transition, the water use for hydraulic fracturing and wastewater production in major shale gas and oil production regions has increased; from 2011 to 2016, the water use per well increased up to 770%, while flowback and produced water volumes generated within the first year of production increased up to 1440%. The water-use intensity (that is, normalized to the energy production) increased ubiquitously in all U.S. shale basins during this transition period. The steady increase of the water footprint of hydraulic fracturing with time implies that future unconventional oil and gas operations will require larger volumes of water for hydraulic fracturing, which will result in larger produced oil and gas wastewater volumes.
…
Nature Unbound IX – 21st Century Climate Change
by Javier, June 28, 2018
A conservative outlook on 21st century climate change
Summary: For the past decade anthropogenic emissions have slowed down, and continuation of current trends suggests a peak in emissions by 2050. Atmospheric CO2levels should reach 500 ppm but might stabilize soon afterwards, as sinks increase their CO2uptake. Solar activity is expected to continue increasing after the present minimum, as the millennial cycle works its way towards a late 21st century peak. The reduction in the rate of warming might continue until ~ 2035 followed by renewed warming, and temperature stabilization at about +1.5°C above pre-industrial. The pause in summer Arctic sea ice melting might also continue until ~ 2035. Renewed melting is probable afterwards, but it is unlikely that Arctic summers will become consistently ice free even by 2100.
…
Spiegel Science Journalist Takes Climate Heat-Hysteria Head On: “Speculation”…”Time For A Cool Examination”
by A. Bojanowski, August 4, 2018 in NoTricksZone/Der Spiegel
Geology major, science journalist Axel Bojanowski just penned a commentary at Spiegel Online on the recent hot weather hype we witnessed in the wake of Europe’s warm and unusually dry summer.
…
The title of his commentary: “Overheated – Forest Fires, Drought, Heat – Has The Climate Catastrophe Already Arrived? Time For A Cool Examination.”
See also here
Evidence for the impact of the 8.2-kyBP climate event on Near Eastern early farmers
by M. Roffet-Salque et al., August 13, 2018
This study reveals that animal fats preserved in pottery vessels from the United Nations Educational, Scientific and Cultural Organization (UNESCO) World Heritage site of Çatalhöyük recorded the abrupt 8.2-thousand years B.P. climatic event in their hydrogen isotopic compositions. In addition, significant changes are observed in the archaeology and faunal assemblage of the site, showing how the early farming community at Çatalhöyük had to adapt to climate change. Significantly, this contribution shows that individual biomolecules preserved in ancient animal fats can be used to reconstruct paleoclimate records and thus, provides a powerful tool for the detection of climatic events at well-dated onsite terrestrial locations (i.e., at the very settlements where human populations lived).
…
Glacier depth affects plankton blooms off Greenland
by Helmholtz Centre for Ocean Research Kiel (GEOMAR), Auhsut 14, 2018 in ScienceDaily
-
The unusual timing of highly-productive summer plankton blooms off Greenland indicates a connection between increasing amounts of meltwater and nutrients in these coastal waters. Researchers now show that this connection exists, but is much more complex than widely supposed. Whether increasing meltwater has a positive or negative effect on summertime phytoplankton depends on the depth at which a glacier sits in the ocean.
-
…
“So, the study shows that further melting of Greenland’s glaciers only leads to stronger summer plankton blooms under very specific conditions, an effect that will ultimately end with very extensive further melting,” Hopwood summarizes the results of the study.