Archives de catégorie : climate-debate

Fungal decisions can affect climate

by American Society of Agronomy, January 31, 2020 in WUWT


But fungi don’t just release carbon. They can also store it. For example, environmental stress can cause fungi to strengthen their cell walls. They do so by using organic compounds that contain carbon. These carbon compounds can stay in soils for years to decades or even longer.

“We found that where drought stress increased, the amount of fungi that invested more in strengthening cell walls and less in decomposition tended to increase,” says Treseder. In contrast, in more moderate conditions, the reverse occurred. Fungi that decomposed more efficiently became more common.

These findings suggest that fungi might store more carbon as global climate becomes more extreme. On the other hand, they might release more carbon dioxide in moderate climates. “These opposing feedbacks would not have been apparent without examining trade-offs among fungal traits,” says Treseder.

Analysis of a carbon forecast gone wrong: the case of the IPCC FAR

by J. Curry, January 31, 2020 in WUWT-C. Rotter


The IPCC’s First Assessment Report (FAR) made forecasts or projections of future concentrations of carbon dioxide that turned out to be too high.

From 1990 to 2018, the increase in atmospheric CO2 concentrations was about 25% higher in FAR’s Business-as-usual forecast than in reality. More generally, FAR’s Business-as-usual scenario expected much more forcing from greenhouse gases than has actually occurred, because its forecast for the concentration of said gases was too high; this was a problem not only for CO2, but also for methane and for gases regulated by the Montreal Protocol. This was a key reason FAR’s projections of atmospheric warming and sea level rise likewise have been above observations.

Some researchers and commentators have argued that this means FAR’s mistaken projections of atmospheric warming and sea level rise do not stem from errors in physical science and climate modelling. After all, emissions are for climate models an input, not an output. Emissions depend largely on economic growth, and can also be affected by population growth, intentional emission reductions (such as those implemented by the aforementioned Montreal Protocol), and other factors that lie outside the field of physical science. Under this line of reasoning, it makes no sense to blame the IPCC for failing to predict the right amount of atmospheric warming and sea level rise, because that would be the same as blaming it for failing to predict emissions.

Readers who have made it to this part of the article probably want a summary, so here it goes:

  • Hausfather estimates that FAR’s Business-as-usual scenario over-projected forcings for the 1990-2017 period by 55%. This would mean a difference of 0.59 w/m2 between FAR and reality.
  • Lower-than-expected concentrations of Montreal Protocol gases explain about 0.19 w/m2 of the difference. With the big caveat that Montreal Protocol accounting is a mess of CFCs, HCFCs, HFCs, stratospheric ozone, and perhaps other things I’m not even aware of.
  • FAR didn’t account for tropospheric ozone, and this ‘unexplains’ about 0.07 w/m2. So there’s still 0.45-0.5 w/m2 of forcing overshoot coming from something else, if Hausfather’s numbers are correct.
  • N2O is irrelevant in these numbers
  • CO2 concentration was significantly over-forecasted by the IPCC, and that of methane grossly so. It’s safe to assume that methane and CO2 account for most or all of the remaining difference between FAR’s projections and reality.

Again, this is a rough calculation. As mentioned before, an exact calculation has to take into account for many issues I didn’t consider here. I really hope Hausfather’s paper is the beginning of a trend in properly evaluating climate models of the past, and that means properly accounting for (and documenting) how expected forcings and actual forcings differed.

Over 440 Scientific Papers Published In 2019 Support A Skeptical Position On Climate Alarm

by K. Richard, January 30, 2020 in NoTricksZone


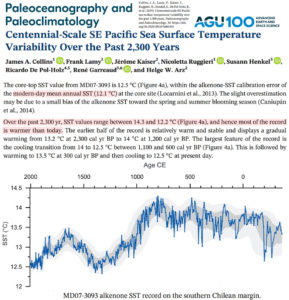
In 2019,  more than 440 scientific papers were published that cast doubt on the position that anthropogenic CO2 emissions function as the climate’s fundamental control knob…or that otherwise serve to question the efficacy of climate models or the related “consensus” positions commonly endorsed by policymakers and mainstream media sources.


CLINTEL Group Blasts Climate Doomsters; There Is No ‘Emergency’

by D. Wojick, Jan 29, 2020 in ClimateChangeDispatch


There is NO climate emergency. Preaching doom and gloom is a crime against the young generation. These are the key points of a new manifesto from the Climate Intelligence Group or CLINTEL.

CLINTEL is a rapidly growing international group, led by prominent scientists, that opposes the ill-founded attempts to scare people into hasty climate policy actions.

They also oppose the terrorizing of children as part of the false climate alarm. CLINTEL recently issued a World Climate Declaration denouncing scaremongering and this new manifesto provides detailed scientific backup for the WCD for a wide public.

The manifesto is authored by Professor Guus Berkhout, the President of CLINTEL.

The focus of the Berkhout manifesto is on climate-related modeling, which it says is “unfit for purpose.” The purpose, in this case, is predicting future climate change. Modeling dominates climate science.

It also provides the scary scenarios that drive hugely expensive and disruptive climate emergency action policies. That the models are faulty is a very important finding.

The manifesto says there are at least four strong reasons why today’s models are no good.

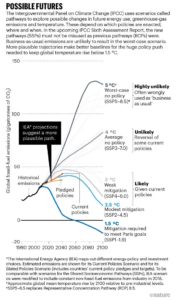
Emissions – the ‘business as usual’ story is misleading

by Z. Hausfather & G. Peters, January 29, 2020 in Nature


Stop using the worst-case scenario for climate warming as the most likely outcome — more-realistic baselines make for better policy.

More than a decade ago, climate scientists and energy modellers made a choice about how to describe the effects of emissions on Earth’s future climate. That choice has had unintended consequences which today are hotly debated. With the Sixth Assessment Report (AR6) from the Intergovernmental Panel on Climate Change (IPCC) moving into its final stages in 2020, there is now a rare opportunity to reboot.


Patterns of thinning of Antarctica’s biggest glacier are opposite to previously observed

by University of Bristol, January 27, 2020 in ScienceDaily


Using the latest satellite technology from the European Space Agency (ESA), scientists from the University of Bristol have been tracking patterns of mass loss from Pine Island — Antarctica’s largest glacier.

They found that the pattern of thinning is evolving in complex ways both in space and time with thinning rates now highest along the slow-flow margins of the glacier, while rates in the fast-flowing central trunk have decreased by about a factor of five since 2007. This is the opposite of what was observed prior to 2010.

Pine Island has contributed more to sea level rise over the past four decades than any other glacier in Antarctica, and as a consequence has become one of its most intensively and extensively investigated ice stream systems.

However, different model projections of future mass loss give conflicting results; some suggesting mass loss could dramatically increase over the next few decades, resulting in a rapidly growing contribution to sea level, while others indicate a more moderate response.

Identifying which is the more likely behaviour is important for understanding future sea level rise and how this vulnerable part of Antarctica is going to evolve over the coming decades.

The results of the new study, published in the journal Nature Geoscience, suggest that rapid migration of the grounding line, the place where the grounded ice first meets the ocean, is unlikely over that timescale, without a major change in ocean forcing. Instead, the results support model simulations that imply that the glacier will continue to lose mass but not at much greater rates than present.

Lead author Professor Jonathan Bamber from the University of Bristol’s School of Geographical Sciences, said: “This could seem like a ‘good news story’ but it’s important to remember that we still expect this glacier to continue to lose mass in the future and for that trend to increase over time, just not quite as fast as some model simulations suggested.

“It’s really important to understand why the models are producing different behaviour in the future and to get a better handle on how the glacier will evolve with the benefit of these new observations.

“In our study, we didn’t make projections but with the aid of these new data we can improve model projections for this part of Antarctica.”

World Leading Alps Glaciologist Shows “Today’s Climate, Vegetation And Glacier Situation Nothing Special”

by H.J. Lüdecke & K.E. Puls, January 25, 2020 in NoTricksZone


Prof. Gernot Patzelt is an internationally renowned glaciologist with numerous publications and lectures. Now he has, as it were, presented his life’s work with the book “Gletscher: Klimazeugen von der Eiszeit bis zur Gegenwart“ (Glaciers: Climate Witnesses from the Ice Age to the Present” (Hatje Cantz-Verlag, Berlin, 2019, 266 pages). It combines the overwhelming artistic aesthetics of Alpine glaciers in painting with scientific glaciology.

Gernot Patzelt, Professor of High Altitude Research at the University of Innsbruck and Head of the Alpine Research Centre Obergurgl in Tyrol, was not and is not retired after his retirement in 2004. His lectures, especially those at EIKE climate conferences (here, here) and his writings, which are listed here, bear witness to this. He was also co-author of the book “A. Fischer und G. Patzelt: Gletscher im Wandel: 125 Jahre Gletscher-Meßdienst des Alpenvereins, Springer, 2018″.

His book “Klimazeugen von der Eiszeit bis zur Gegenwart” (Climate Witnesses from the Ice Age to the Present), which is discussed here, breaks new ground by making the otherwise rarely attempted connection between natural aesthetics and scientific description. The Austrian glaciologist  has convincingly succeeded in this attempt, namely the connection of painting history with Ice Age history, glacier history, landscape history, vegetation history, climate history, cultural history … and more!

Jakarta is not an Exemplar of Sea Level Rise

by K. Hansen, January 25, 2020 in WUWT


Ted Nordhaus has an excellent article in the Wall Street Journal titled “Ignore the Fake Climate Debate”.

[  It may or may not be pay-walled for you — if it is, try searching the title in your search engine and use the link provided by Google/Bing/whatever — it may let you in or see here. ]


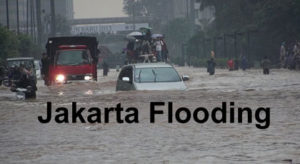
Jakarta, Indonesia, is not an exemplar of rising sea levels    

 Jakarta is a good proxy for many of the problems that Asian cities are having with sea levels — relative sea levels.   Is Relative Sea Level a problem specific to Asian cities?  No, but it is a common problem to Asian mega-cities as can be seen in this figure:

Negative CO2 Emissions

by Kevin Kilty, January 24, 2020 in WUWT


An article in the January 2020 Issue of Physics Today (1) presents an interesting and very readable overview of methods to capture and store away CO2 emissions. The purpose of this guest blog is to summarize a few key points the paper makes, and add some commentary. WUWT has covered some of this same territory recently here and here.

Motivation

Of course, the motivation for negative emissions technologies (NETs), or CO2 capture, is to bring atmospheric CO2 back to safe levels. Although the article fails to mention what safe means in this context, and what levels are unsafe, it alludes to melting polar ice and methane escaping from melting permafrost as consequences of unsafe climate. Nothing unusual here. Despite relegating its case for an unsafe future to such enterprises as the IPCC, the article does provide some insight into the cause of what seems to be the current “crisis” mentality. It is 1.5°C temperature rise goal of the 2015 Paris agreement. As readers of WUWT already know, this is not a 1.5°C increase from now, but rather from an estimated pre-industrial level — meaning that two-thirds of that margin is already gone and we have but 0.5°C left to work with. I suspect most people do not understand this subtle point.

Eventually the article makes a brief excursion into more phenomena by which climate change would become unsafe — forest fires, droughts, and sea level rise. All of this is also familiar to WUWT readers.


Technologies Involved

Extreme Arctic melting has a new suspect: The same powerful gases screwing over the ozone

by B.L. Beckman, January 21, 2020 in Mashable/Nature


They were once abundant, in our hairsprays, bug sprays, and refrigerators. And then scientists figured out these substances ripped a hole in the ozone layer, leading to a 1987 plan to phase them out that over time would be agreed to by every country in the world.

More than three decades later, researchers have made a new discovery.

Ozone-depleting substances do more than just gnaw at Earth’s protective layer. They’re also greenhouse gases, so they contribute to the planet’s overall warming by trapping heat, too. And now we may know just how much these substances have contributed to Arctic warming, thanks to a study published in the science journal Nature on Monday.

Between 1955 and 2005, ozone-depleting gases caused half of Arctic climate change (and a third of overall global warming), the study finds. This is primarily due to their heat-trapping qualities, not their ozone munching. The Arctic has seen rapidly melting sea ice for years and is warming faster than the rest of the world.

HISTORICAL DATA DESTROYS THE GLOBAL WARMING MYTH, AND PEOPLE ARE WAKING TO IT…

by Cap Allon, January 22, 2020 in Electroverse


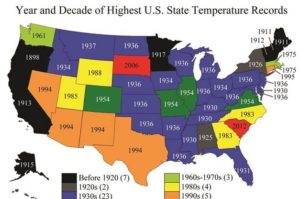
According to NOAA’s own historical data, of the 50 U.S. state all-time record high temperatures, 23 were set during the 1930s, while 36 occurred prior to 1960 — climate change proponents are feeding us a fairy tale, and I’m sick of it…

The maniacal sociopaths of the world may have won control of the narrative, but they seemingly have little sway over the will of the people. You need only browse the comment section below any “climate change” article or social media post to see the wave of folks resoundingly rejecting the scam-of-a-world-view assembled before them (one of the few positives of SM).

The man-made global warming rejection is likely down to two things: the first being that the so called “scientific consensus” has been failing for far too long — you can’t start warning people in the 1980s that we have 10 years left to save the planet, only to keep repeating that prophecy for the next 4 decades. This is probably the reason our youth have become the new target — kids don’t have this history of failure to draw-upon when browsing the bullet points of the latest IPCC report -for example- meaning they’re far easier to manipulate.


Learning The Lessons From The Waroona Bushfires

by P. Homewood, January 22, 2020 in NotaLotofPeopleKnowThat


It has surely now been established beyond any possible doubt the major role that poor fire hazard management has played in the severity of recent Australian bushfires, despite disinformation campaigns from the BBC/Guardian/Met Office.

Back in 2016, a Special Inquiry was held following the catastrophic Waroona bushfire, just south of Perth that year. Their report not only reemphasised the crucial role of controlled burning, but also gives an insight into the evolution of such practices in recent decades:

Below is the key segment of the report. [The data relates to Western Australia, and P&W refers to the Department of Parks and Wildlife].

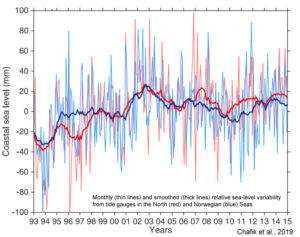
North Atlantic Sea Levels Have Been Falling At A Rate Of 7.1 mm/yr Since 2004…In Tandem With 2°C Cooling

by K. Richard/Chafik et al. 2019, January 20, 2020 in NoTricksZone


Rapid cooling in the North Atlantic has reversed regional sea level changes and has apparently spread to the Greenland ice sheet

Image Source: Chafik et al. (2019)

Despite stressing global sea level rise is worrisome and due to anthropogenic warming, Chafik et al. (2019) report a distinct cooling trend in the North Atlantic that coincides with a transition to falling regional sea levels since 2004.

Doomsday Climate Predictions: Wrong Then, Wrong Now

by CFACT, January 20, 2020, in ClimateChangeDispatch


How many doomsday predictions about the Earth’s climate must fail before they finally get broadly ignored and dismissed out of hand?

Considering the track record of climate predictions that turned out to be false, we are well passed the moment of ridicule.

The latest climate prediction fiasco, about glaciers disappearing in Glacier National Park by 2020, is the latest reminder of the falsity of the man-made global warming movement.  It’s 2020; the glaciers remain.

Predictions of climate catastrophe drone on, and get more hysterical, including many from the same people whose credibility was destroyed long ago.

Yet, the climate alarmists remain undaunted and impervious to embarrassment.

Instead, they simply move the goalposts by predicting more planetary weather Armageddon in the future and proposing more insanely expensive solutions to “address” it (notice they rarely promise to reverse assumed man-made warming).

It is not just actors like Ted Danson or Jane Fonda who make absurd climate predictions, but scientists, government bureaucrats and especially politicians continue this longstanding racket.

In the years leading up to the first “Earth Day” in 1970, there were so many climate predictions that ended up being laughably wrong, it’s hard to pick favorites.

Stanford University biologist, Paul Ehrlich, author of The Population Bomb, is perhaps the best-known alarmist of that period.


Continuer la lecture de Doomsday Climate Predictions: Wrong Then, Wrong Now

2019 Science Refutes Climate Alarm On Every Front… Shrinking Deserts, Growing Islands, Crumbling Consensus, Weaker Storms, Cooler Arctic Etc. Etc. Etc.

by P. Gosselin, December 31, 2019 in NoTricksZone


2019 science: Absolutely no climate alarm 

No alarm on every aspect: stable polar ice, normal sea level rise, no consensus, growing snow cover, less tropical storms, tornadoes, shrinking deserts, global greening, predictions wrong, models flawed, climate driven by sun, ocean cycles, biodiversity, warmer 1000 years ago…etc…


2019 saw a great amount of new science emerge showing that there’s nothing alarming or catastrophic about our climate. 

Some 2019 scientific findings

Need to make a presentation showing there is no climate alarm? The following findings we reported on in 2019 will put many concerns to rest.

Hundreds of peer-reviewed papers ignored by media

What follows are some selected top science-based posts we published here at NoTricksZone in 2019. These new findings show there is absolutely no climate alarm.

Hundreds of new peer-reviewed papers, charts, findings, etc – which the IPCC, activists and media ignore and even conceal. No wonder they’ve gotten so shrill.


Comprehensive Data, Recent Studies In Top Journals: Antarctica Stable, Temps Falling, Ice Mass Growing!

by P. Gosselin, January 14, 2020 in NoTricksZone


The ice in Antarctica, how is it doing? Is it melting, is it growing? In the following we wishto present the latest literature on the subject. There is a lot to report.

Fasten your seat belt, there’s a lot to cover.

Let’s start with the temperature development because along with snowfall, this is the most important control factor for Antarctic inland ice.

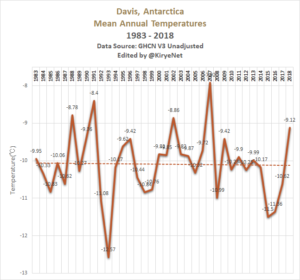
At NoTricksZone, Kirye shows ten coastal stations of Antarctica. None have been warming over the past 10 years. An example follows:


And here’s the temperature development of the entire Antarctic according to UAH and RSS satellite measurements (from Climate4You, via NoTricksZone):

NASA: 2020 Will Mark the Lowest Solar Activity in 200 Years

by James Murphy, January 16, 2020 in NewAmerican


With all of the pseudo-scientific propaganda being peddled about anthropogenic climate change, people sometimes forget that there are other, far more important drivers of the Earth’s climate than mankind’s carbon dioxide emissions. For example, that big ball of yellow light in the sky (aka the sun) has a huge effect on climate. And according to NASA, this year will mark the lowest level of solar activity in 200 years.

“Research now underway may have found a reliable new method to predict this solar activity. The Sun’s activity rises and falls in an 11-year cycle. The forecast for the next solar cycle says it will be the weakest of the last 200 years. The maximum of this next cycle — measured in terms of sunspot number, a standard measure of solar activity level — could be 30-50 percent lower than the most recent one. The results show that the next cycle will start in 2020 and reach its maximum in 2025.”

According to a growing number of scientists, the coming lower solar cycle — number 25 — may simply be a precursor to a period of prolonged solar minima such as the Maunder and Spörer minimums of the past millennium.


Major Greenland Glacier Is Growing

by NASA (Earth Observatory), June 6, 2019 in NASA.E.Observ.


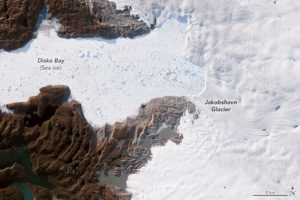
Jakobshavn Glacier in western Greenland is notorious for being the world’s fastest-moving glacier. It is also one of the most active, discharging a tremendous amount of ice from the Greenland Ice Sheet into Ilulissat Icefjord and adjacent Disko Bay—with implications for sea level rise. The image above, acquired on June 6, 2019, by the Operational Land Imager (OLI) on Landsat 8, shows a natural-color view of the glacier.

Jakobshavn has spent decades in retreat—that is, until scientists observed an unexpected advance between 2016 and 2017. In addition to growing toward the ocean, the glacier was found to be slowing and thickening. New data collected in March 2019 confirm that the glacier has grown for the third year in a row, and scientists attribute the change to cool ocean waters.

“The third straight year of thickening of Greenland’s biggest glacier supports our conclusion that the ocean is the culprit,” said Josh Willis, an ocean scientist at NASA’s Jet Propulsion Laboratory and principal investigator of the Oceans Melting Greenland (OMG) mission

Gavin’s Falsifiable Science

by Willis Eschenbach, January 18, 2020 in WUWT


Folks are interested in why the temperature of the planet changes over time. That’s at the center of modern climate science. My theory, on the other hand, arose from my being interested in a totally different question about climate—why is the temperature so stable? For example, over the 20th Century, the temperature only varied by ± 0.3°C. In the giant heat engine that is the climate, which is constantly using solar energy to circulate the oceans and the atmosphere, this is a variation of 0.1% … as someone who has dealt with a variety of heat engines, I can tell you that this is amazing stability. The system is ruled by nothing more solid than waves, wind, and water. So my question wasn’t why the climate changes as it does.

My question was, why is the climate so stable?

And my answer is, there are a host of what are called “emergent phenomena” that arise when local temperatures go above some local threshold. They include the timing and strength of the daily emergence of the cumulus cloud field in the tropics; the development of thunderstorms; the emergence of dust devils when temperatures get hot; the action of the El Nino/La Nina pump moving warm water to the poles; and various “oscillations” like the Pacific Decadal Oscillation.

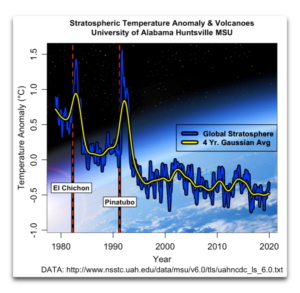
These emergent phenomena arise out of nowhere, last for some length of time, and then disappear completely. And acting together, they all work to prevent both the overcooling and the overheating of the planet. And as mentioned above, I say that these phenomena acted to reduce the length and the depth of the effect of the Pinatubo volcano. See my post called “When Eruptions Don’t” for another look at how the climate system responds to a decrease in incoming solar energy due to volcanic eruptions.


I originally published this theory in the journal Energy and Environment. I followed that up with a posting of the same ideas here at Watts Up With That in a post called The Thermostat Hypothesis.

Figure 2. Global stratospheric temperatures measured from space.

New 80-Year Deep-Ocean Temperature Dataset Compared to a 1D Climate Model

by Roy Spencer, January 15, 2020 in WUWT/Ch.Rotter


The increasing global ocean heat content (OHC) is often pointed to as the most quantitative way to monitor long-term changes in the global energy balance, which is believed to have been altered by anthropogenic greenhouse gas emissions. The challenge is that long-term temperature changes in the ocean below the top hundred meters or so become exceedingly small and difficult to measure. The newer network of Argo floats since the early 2000s has improved global coverage dramatically.

A new Cheng et al. (2020) paper describing record warm ocean temperatures in 2019 has been discussed by Willis Eschenbach who correctly reminds us that such “record setting” changes in the 0-2000 m ocean heat content (reported in Zettajoules, which is 10^^21 Joules) amount to exceedingly small temperature changes. I calculate from their data that 2019 was only 0.004 0.009 deg. C warmer than 2018.

Over the years I have frequently pointed out that the global energy imbalance (less than 1 W/m2) corresponding to such small rates of warming is much smaller than the accuracy with which we know the natural energy flows (1 part in 300 or so), which means Mother Nature could be responsible for the warming and we wouldn’t even know it.

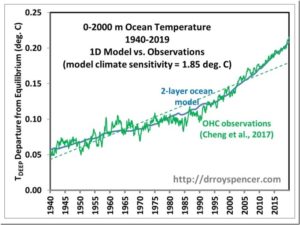
The Cheng (2017) dataset of 0-2000m ocean heat content changes extends the OHC record back to 1940 (with little global coverage) and now up through 2019. The methodology of that dataset uses optimum interpolation techniques to intelligently extend the geographic coverage of limited data. I’m not going to critique that methodology here, and I agree with those who argue creating data where it does not exist is not the same as having real data. Instead I want to answer the question:

If we take the 1940-2019 global OHC data (as well as observed sea surface temperature data) at face value, and assume all of the warming trend was human-caused, what does it imply regarding equilibrium climate sensitivity (ECS)?

Fig. 1. Deep-ocean temperature variations 1940-2019 explained with a 2-layer energy budget model forced with RCP6 radiative forcing scenario and a model climate sensitivity of 1.85 deg. C. The model also matches the 1940-2019 and 1979-2019 observed sea surface temperature trends to about 0.01 C/decade. If ENSO effects are not included in the model, the ECS is reduced to 1.7 deg. C.

19 Papers Published In 2019 Affirm Sea Levels Were METERS Higher Than Today 4-8 Thousand Years Ago

by K. Richard, January 16, 2020 in NoTricksZone


The onslaught of paleoclimate evidence for warmer-than-now Mid-Holocene climates – when the Earth’s sea levels were meters higher than they are today –  stormed through 2019.

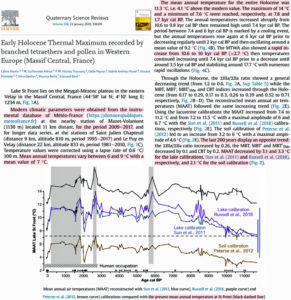
There were 107 scientific papers published this past year indicating today’s warmth isn’t even close to being unusual or unprecedented when compared to the climates of the last centuries to millennia.

As illustrated below, there were also 19 papers affirming today’s sea levels are among the lowest of the last ~8000 years.

This is added to the list of nearly 100 scientific papers published in the last handful of years indicating Mid-Holocene sea levels were multiple meters higher than they are today due to the much more extensive glacier and ice sheet melt occuring during these millennia.

Throwing More Cold Water On An Alarmist Ocean-Warming Paper

by Dr. D. Whitehouse, January 17, 2020 in ClimateChangeDispatch


It’s the usual story. It’s the beginning of the year and the statistics of the previous year are hurriedly collected to tell the story of the ongoing climate crisis.

First off, we have the oceans which, according to some, are living up to the apocalyptic narrative better than the atmosphere.

The atmosphere is complicated, subjected to natural variabilities, that make the temperature increase open to too much interpretation.

The oceans, however, are far more important than the air as they absorb most of the anthropogenic excess heat.

Looking at the literature reveals no one knows just how much excess heat (created in the atmosphere) it mops up or indeed exactly how or where it does it. Some say it is 60% which is a bit on the low side, most say 90% or 93%.

The real figure is unknown though it should be noted that a few percent errors translate to a lot of energy, about the same amount that is causing all the concern.

On 14 January the Guardian had the headline, “Ocean temperatures hit record high as the rate of heating accelerates.” The study that reached this conclusion was published in the journal Advances in Atmospheric Sciences.

It’s a badly written paper full of self-justifying statements and unwarranted assumptions that should have been stripped-out by the editor.


Also : Ocean Warming: Not As Simple As Headlines Say

While NOAA/NASA claims 2019 as the “second warmest year ever”, other data shows 2019 cooler than 2005 for USA.

by Anthony Watts, January 15, 2020 in WUWT


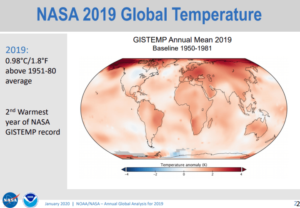
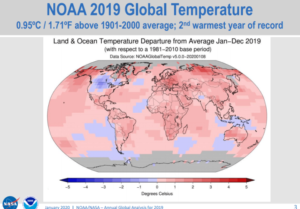
Today, at the big 100 year anniversary shindig of the American Meteorological Society (AMS) there was a press release session that featured NOAA and NASA GISS talking about how their climate data says that the world in 2019 was the second warmest ever.

Here is their slideshow presentation, released today: https://www.ncdc.noaa.gov/sotc/briefings/20200115.pdf

In my opinion, the NOAA/NASA press release (and slideshow) is inconsistently presented. For example, they can’t even agree on a common base period for comparisons. Some graphs use 1951-1980 while others compare to 1981-2010 averages to create anomaly plots. NOAA and NASA owe it to the public to present climate data with a consistent climate period for comparison, otherwise it’s just sloppy science. NASA GISS has consistently resisted updating the 1951-1980 NASA GISS baseline period to the one NOAA and other datasets use, which is 1981-2010. GISS stubbornly refuses to change even though they have been repeatedly excoriated for keeping it.

That 1951-1980 period just so happens to be the coolest period in the 20th century, so by using that as a baseline, the peak amount of warming anomaly is magnified in NASA GISS plots. Most laymen will never spot this. A simple comparison of the two maps show the difference in the peak values:


The Ocean Warms By A Whole Little

by Willis Eschenbach, January 4, 2020 in WUWT


How much is a “Whole Little”? Well, it’s like a whole lot, only much, much smaller.

There’s a new paper out. As usual, it has a whole bunch of authors, fourteen to be precise. My rule of thumb is that “The quality of research varies inversely with the square of the number of authors” … but I digress.

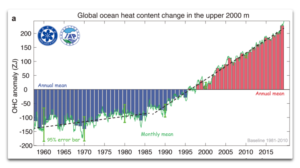
In this case, they’re mostly Chinese, plus some familiar western hemisphere names like Kevin Trenberth and Michael Mann. Not sure why they’re along for the ride, but it’s all good. The paper is “Record-Setting Ocean Warmth Continued in 2019“. Here’s their money graph:


Figure 1. Original Caption: “Fig. 1. (a) Upper 2000 m OHC from 1955 through 2019. The histogram represents annual anomalies (units: ZJ), wherein positive anomalies relative to a 1981−2010 baseline are shown as red bars and negative anomalies as blue. The two black dashed lines are the linear trends over 1955–86 and 1987−2019, respectively.”


So here’s the hot news. According to these folks, over the last sixty years, the ocean has warmed a little over a tenth of one measly degree … now you can understand why they put it in zettajoules—it’s far more alarming that way.

Next, I’m sorry, but the idea that we can measure the temperature of the top two kilometers of the ocean with an uncertainty of ±0.003°C (three-thousandths of one degree) is simply not believable.

Also Ocean Warming Scares

Also : New 80-Year Deep-Ocean Temperature Dataset Compared to a 1D Climate Model