Archives par mot-clé : Fun?/Discussion

Fungal decisions can affect climate

by American Society of Agronomy, January 31, 2020 in WUWT


But fungi don’t just release carbon. They can also store it. For example, environmental stress can cause fungi to strengthen their cell walls. They do so by using organic compounds that contain carbon. These carbon compounds can stay in soils for years to decades or even longer.

“We found that where drought stress increased, the amount of fungi that invested more in strengthening cell walls and less in decomposition tended to increase,” says Treseder. In contrast, in more moderate conditions, the reverse occurred. Fungi that decomposed more efficiently became more common.

These findings suggest that fungi might store more carbon as global climate becomes more extreme. On the other hand, they might release more carbon dioxide in moderate climates. “These opposing feedbacks would not have been apparent without examining trade-offs among fungal traits,” says Treseder.

Analysis of a carbon forecast gone wrong: the case of the IPCC FAR

by J. Curry, January 31, 2020 in WUWT-C. Rotter


The IPCC’s First Assessment Report (FAR) made forecasts or projections of future concentrations of carbon dioxide that turned out to be too high.

From 1990 to 2018, the increase in atmospheric CO2 concentrations was about 25% higher in FAR’s Business-as-usual forecast than in reality. More generally, FAR’s Business-as-usual scenario expected much more forcing from greenhouse gases than has actually occurred, because its forecast for the concentration of said gases was too high; this was a problem not only for CO2, but also for methane and for gases regulated by the Montreal Protocol. This was a key reason FAR’s projections of atmospheric warming and sea level rise likewise have been above observations.

Some researchers and commentators have argued that this means FAR’s mistaken projections of atmospheric warming and sea level rise do not stem from errors in physical science and climate modelling. After all, emissions are for climate models an input, not an output. Emissions depend largely on economic growth, and can also be affected by population growth, intentional emission reductions (such as those implemented by the aforementioned Montreal Protocol), and other factors that lie outside the field of physical science. Under this line of reasoning, it makes no sense to blame the IPCC for failing to predict the right amount of atmospheric warming and sea level rise, because that would be the same as blaming it for failing to predict emissions.

Readers who have made it to this part of the article probably want a summary, so here it goes:

  • Hausfather estimates that FAR’s Business-as-usual scenario over-projected forcings for the 1990-2017 period by 55%. This would mean a difference of 0.59 w/m2 between FAR and reality.
  • Lower-than-expected concentrations of Montreal Protocol gases explain about 0.19 w/m2 of the difference. With the big caveat that Montreal Protocol accounting is a mess of CFCs, HCFCs, HFCs, stratospheric ozone, and perhaps other things I’m not even aware of.
  • FAR didn’t account for tropospheric ozone, and this ‘unexplains’ about 0.07 w/m2. So there’s still 0.45-0.5 w/m2 of forcing overshoot coming from something else, if Hausfather’s numbers are correct.
  • N2O is irrelevant in these numbers
  • CO2 concentration was significantly over-forecasted by the IPCC, and that of methane grossly so. It’s safe to assume that methane and CO2 account for most or all of the remaining difference between FAR’s projections and reality.

Again, this is a rough calculation. As mentioned before, an exact calculation has to take into account for many issues I didn’t consider here. I really hope Hausfather’s paper is the beginning of a trend in properly evaluating climate models of the past, and that means properly accounting for (and documenting) how expected forcings and actual forcings differed.

The Solution To Dissolution

by Willis Eschenbach, January 31, 2020 in WUWT


The British tabloid “The Guardian” has a new scare story about what is wrongly called “ocean acidification”. It opens as follows:


Pacific Ocean’s rising acidity causes Dungeness crabs’ shells to dissolve

Acidity is making shells of crab larvae more vulnerable to predators and limiting effectiveness in supporting muscle growth


The Pacific Ocean is becoming so acidic it is starting to dissolve the shells of a key species of crab, according to a new US study.


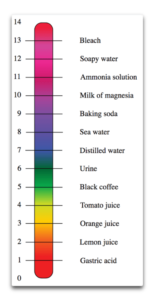
Sounds like the end of times, right? So let me start with a simple fact. The ocean is NOT acidic. Nor will it ever become acidic, except in a few isolated locations. It is alkaline, also called “basic”. The level of acidity/alkalinity is expressed on the “pH” scale, where neutral is 7.0, alkaline is from 7 to 14, and acidic is from 0 to 7.

Figure 1. The pH scale, running from the most acid at the bottom, through neutral in the middle, and up to the most alkaline at the top.

From the chart, the ocean has a pH of around 8 (although as we’ll see, that conceals great variation).


Over 440 Scientific Papers Published In 2019 Support A Skeptical Position On Climate Alarm

by K. Richard, January 30, 2020 in NoTricksZone


In 2019,  more than 440 scientific papers were published that cast doubt on the position that anthropogenic CO2 emissions function as the climate’s fundamental control knob…or that otherwise serve to question the efficacy of climate models or the related “consensus” positions commonly endorsed by policymakers and mainstream media sources.


CLINTEL Group Blasts Climate Doomsters; There Is No ‘Emergency’

by D. Wojick, Jan 29, 2020 in ClimateChangeDispatch


There is NO climate emergency. Preaching doom and gloom is a crime against the young generation. These are the key points of a new manifesto from the Climate Intelligence Group or CLINTEL.

CLINTEL is a rapidly growing international group, led by prominent scientists, that opposes the ill-founded attempts to scare people into hasty climate policy actions.

They also oppose the terrorizing of children as part of the false climate alarm. CLINTEL recently issued a World Climate Declaration denouncing scaremongering and this new manifesto provides detailed scientific backup for the WCD for a wide public.

The manifesto is authored by Professor Guus Berkhout, the President of CLINTEL.

The focus of the Berkhout manifesto is on climate-related modeling, which it says is “unfit for purpose.” The purpose, in this case, is predicting future climate change. Modeling dominates climate science.

It also provides the scary scenarios that drive hugely expensive and disruptive climate emergency action policies. That the models are faulty is a very important finding.

The manifesto says there are at least four strong reasons why today’s models are no good.

World Leading Alps Glaciologist Shows “Today’s Climate, Vegetation And Glacier Situation Nothing Special”

by H.J. Lüdecke & K.E. Puls, January 25, 2020 in NoTricksZone


Prof. Gernot Patzelt is an internationally renowned glaciologist with numerous publications and lectures. Now he has, as it were, presented his life’s work with the book “Gletscher: Klimazeugen von der Eiszeit bis zur Gegenwart“ (Glaciers: Climate Witnesses from the Ice Age to the Present” (Hatje Cantz-Verlag, Berlin, 2019, 266 pages). It combines the overwhelming artistic aesthetics of Alpine glaciers in painting with scientific glaciology.

Gernot Patzelt, Professor of High Altitude Research at the University of Innsbruck and Head of the Alpine Research Centre Obergurgl in Tyrol, was not and is not retired after his retirement in 2004. His lectures, especially those at EIKE climate conferences (here, here) and his writings, which are listed here, bear witness to this. He was also co-author of the book “A. Fischer und G. Patzelt: Gletscher im Wandel: 125 Jahre Gletscher-Meßdienst des Alpenvereins, Springer, 2018″.

His book “Klimazeugen von der Eiszeit bis zur Gegenwart” (Climate Witnesses from the Ice Age to the Present), which is discussed here, breaks new ground by making the otherwise rarely attempted connection between natural aesthetics and scientific description. The Austrian glaciologist  has convincingly succeeded in this attempt, namely the connection of painting history with Ice Age history, glacier history, landscape history, vegetation history, climate history, cultural history … and more!

2019 Science Refutes Climate Alarm On Every Front… Shrinking Deserts, Growing Islands, Crumbling Consensus, Weaker Storms, Cooler Arctic Etc. Etc. Etc.

by P. Gosselin, December 31, 2019 in NoTricksZone


2019 science: Absolutely no climate alarm 

No alarm on every aspect: stable polar ice, normal sea level rise, no consensus, growing snow cover, less tropical storms, tornadoes, shrinking deserts, global greening, predictions wrong, models flawed, climate driven by sun, ocean cycles, biodiversity, warmer 1000 years ago…etc…


2019 saw a great amount of new science emerge showing that there’s nothing alarming or catastrophic about our climate. 

Some 2019 scientific findings

Need to make a presentation showing there is no climate alarm? The following findings we reported on in 2019 will put many concerns to rest.

Hundreds of peer-reviewed papers ignored by media

What follows are some selected top science-based posts we published here at NoTricksZone in 2019. These new findings show there is absolutely no climate alarm.

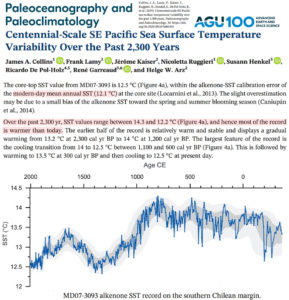
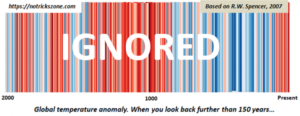
Hundreds of new peer-reviewed papers, charts, findings, etc – which the IPCC, activists and media ignore and even conceal. No wonder they’ve gotten so shrill.


Gavin’s Falsifiable Science

by Willis Eschenbach, January 18, 2020 in WUWT


Folks are interested in why the temperature of the planet changes over time. That’s at the center of modern climate science. My theory, on the other hand, arose from my being interested in a totally different question about climate—why is the temperature so stable? For example, over the 20th Century, the temperature only varied by ± 0.3°C. In the giant heat engine that is the climate, which is constantly using solar energy to circulate the oceans and the atmosphere, this is a variation of 0.1% … as someone who has dealt with a variety of heat engines, I can tell you that this is amazing stability. The system is ruled by nothing more solid than waves, wind, and water. So my question wasn’t why the climate changes as it does.

My question was, why is the climate so stable?

And my answer is, there are a host of what are called “emergent phenomena” that arise when local temperatures go above some local threshold. They include the timing and strength of the daily emergence of the cumulus cloud field in the tropics; the development of thunderstorms; the emergence of dust devils when temperatures get hot; the action of the El Nino/La Nina pump moving warm water to the poles; and various “oscillations” like the Pacific Decadal Oscillation.

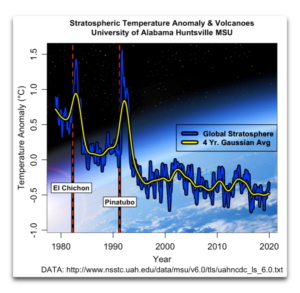
These emergent phenomena arise out of nowhere, last for some length of time, and then disappear completely. And acting together, they all work to prevent both the overcooling and the overheating of the planet. And as mentioned above, I say that these phenomena acted to reduce the length and the depth of the effect of the Pinatubo volcano. See my post called “When Eruptions Don’t” for another look at how the climate system responds to a decrease in incoming solar energy due to volcanic eruptions.


I originally published this theory in the journal Energy and Environment. I followed that up with a posting of the same ideas here at Watts Up With That in a post called The Thermostat Hypothesis.

Figure 2. Global stratospheric temperatures measured from space.

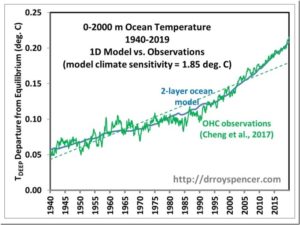
New 80-Year Deep-Ocean Temperature Dataset Compared to a 1D Climate Model

by Roy Spencer, January 15, 2020 in WUWT/Ch.Rotter


The increasing global ocean heat content (OHC) is often pointed to as the most quantitative way to monitor long-term changes in the global energy balance, which is believed to have been altered by anthropogenic greenhouse gas emissions. The challenge is that long-term temperature changes in the ocean below the top hundred meters or so become exceedingly small and difficult to measure. The newer network of Argo floats since the early 2000s has improved global coverage dramatically.

A new Cheng et al. (2020) paper describing record warm ocean temperatures in 2019 has been discussed by Willis Eschenbach who correctly reminds us that such “record setting” changes in the 0-2000 m ocean heat content (reported in Zettajoules, which is 10^^21 Joules) amount to exceedingly small temperature changes. I calculate from their data that 2019 was only 0.004 0.009 deg. C warmer than 2018.

Over the years I have frequently pointed out that the global energy imbalance (less than 1 W/m2) corresponding to such small rates of warming is much smaller than the accuracy with which we know the natural energy flows (1 part in 300 or so), which means Mother Nature could be responsible for the warming and we wouldn’t even know it.

The Cheng (2017) dataset of 0-2000m ocean heat content changes extends the OHC record back to 1940 (with little global coverage) and now up through 2019. The methodology of that dataset uses optimum interpolation techniques to intelligently extend the geographic coverage of limited data. I’m not going to critique that methodology here, and I agree with those who argue creating data where it does not exist is not the same as having real data. Instead I want to answer the question:

If we take the 1940-2019 global OHC data (as well as observed sea surface temperature data) at face value, and assume all of the warming trend was human-caused, what does it imply regarding equilibrium climate sensitivity (ECS)?

Fig. 1. Deep-ocean temperature variations 1940-2019 explained with a 2-layer energy budget model forced with RCP6 radiative forcing scenario and a model climate sensitivity of 1.85 deg. C. The model also matches the 1940-2019 and 1979-2019 observed sea surface temperature trends to about 0.01 C/decade. If ENSO effects are not included in the model, the ECS is reduced to 1.7 deg. C.

Throwing More Cold Water On An Alarmist Ocean-Warming Paper

by Dr. D. Whitehouse, January 17, 2020 in ClimateChangeDispatch


It’s the usual story. It’s the beginning of the year and the statistics of the previous year are hurriedly collected to tell the story of the ongoing climate crisis.

First off, we have the oceans which, according to some, are living up to the apocalyptic narrative better than the atmosphere.

The atmosphere is complicated, subjected to natural variabilities, that make the temperature increase open to too much interpretation.

The oceans, however, are far more important than the air as they absorb most of the anthropogenic excess heat.

Looking at the literature reveals no one knows just how much excess heat (created in the atmosphere) it mops up or indeed exactly how or where it does it. Some say it is 60% which is a bit on the low side, most say 90% or 93%.

The real figure is unknown though it should be noted that a few percent errors translate to a lot of energy, about the same amount that is causing all the concern.

On 14 January the Guardian had the headline, “Ocean temperatures hit record high as the rate of heating accelerates.” The study that reached this conclusion was published in the journal Advances in Atmospheric Sciences.

It’s a badly written paper full of self-justifying statements and unwarranted assumptions that should have been stripped-out by the editor.


Also : Ocean Warming: Not As Simple As Headlines Say

Les Feux en Australie : la réalité des faits et rien d’autre…

by Yannick Colleu, 17 janvier 2020 in ScienceClimatEnergie


Les feux de brousse en Australie font la une des journaux écrits et audiovisuels. Ces annonces sont reprises par les réseaux sociaux.
La vérité médiatique est maintenant bien établie, ces feux sont l’œuvre du dérèglement climatique. Ces catastrophes humaine et écologique présagent, selon les réseaux dits sociaux, la fin du Monde annoncée par les « experts » du GIEC.

A ma connaissance pas un seul journaliste ne semble s’être penché sur le sujet. Du moins aucune autre conclusion, quant aux causes de cette catastrophe, n’a été, à ma connaissance, publiée sinon pour pointer le changement climatique comme seul et unique coupable.

Pourtant la réponse est moins évidente.

Il est de notoriété publique que l’Australie est un pays coutumier des sécheresses et des températures extrêmes. En outre c’est un pays quasi désertique de 7,7 millions de km² peuplé d’à peine 25 millions d’habitants principalement implantés dans les grandes villes de la côte Est et dans la principale métropole de l’Ouest.

Après les gigantesques feux de brousse de janvier à mars 1961 en Australie occidentale les réflexions sur les actions de prévention conduisaient à préconiser l’usage de feux déclenchés/contrôlés pour maîtriser la végétation à l’approche de la saison sèche. Cette technique permet en effet de créer des coupe-feux et de limiter la matière inflammable qui nourrit les brasiers.

Cette politique préventive a longtemps porté ses fruits, réduisant considérablement les incendies et surtout leur propagation. Néanmoins les chantres de la lutte contre le réchauffement et le CO2 ont poussé le gouvernement australien à changer de politique il y a une dizaine d’années (par exemple ici et ici).

La politique actuelle ne privilégie plus l’anticipation du risque d’incendie mais préconise de laisser les incendies se propager et de ne défendre autant faire se peut que les habitations et les vies humaines.
De fait la végétation n’est plus façonnée par l’homme pour limiter les risques de propagation et celle-ci offre dès lors un combustible abondant au moindre foyer qui se développe.

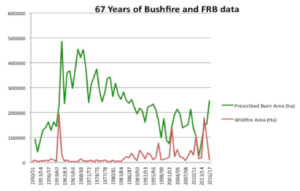
Le graphique ci-dessous fournit par l’association Bushfire Front Inc (BFF) de l’État d’Australie occidentale révèle l’impact que cet abandon d’une politique de prévention sur les feux de brousse sur la période 1950-2017.

En vert : surface de feux déclenchés.
En rouge : surface de feux de brousse


Source : https://www.bushfirefront.org.au/prescribed-burning/why-prescribed-burning/
Légende : La zone d’incendie contrôlé (réduction de ‘carburant’) est indiquée en vert et la zone des feux de brousse (feux de forêt) en rouge. Les pics causés par désastreuse saison des incendies de 1961 et les grands feux de brousse de ces dernières années sont clairement visibles.

IPCC Expert’s 8 Discredited Papers

by Donna Laframboise, January 12, 2020 in BigPicturesNews


Philip Munday’s work falls to pieces whenever someone tries to verify it.

Last week, Nature published a damning refutation of a significant body of climate change research. The title of that article is self-explanatory: Ocean acidification does not impair the behaviour of coral reef fishes.

The authors studied more than 900 fish from six different species over a period of three years, attempting to verify earlier findings by a team of researchers at Australia’s James Cook University. Their attempts failed.

Scholarly convention being what it is, the now-discredited work isn’t identified in a clear manner. Readers are compelled to sift through footnotes to locate the “several high-profile papers” that are being refuted. So here they are:

….

Continuer la lecture de IPCC Expert’s 8 Discredited Papers

The Ocean Warms By A Whole Little

by Willis Eschenbach, January 4, 2020 in WUWT


How much is a “Whole Little”? Well, it’s like a whole lot, only much, much smaller.

There’s a new paper out. As usual, it has a whole bunch of authors, fourteen to be precise. My rule of thumb is that “The quality of research varies inversely with the square of the number of authors” … but I digress.

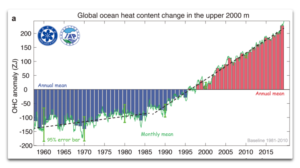
In this case, they’re mostly Chinese, plus some familiar western hemisphere names like Kevin Trenberth and Michael Mann. Not sure why they’re along for the ride, but it’s all good. The paper is “Record-Setting Ocean Warmth Continued in 2019“. Here’s their money graph:


Figure 1. Original Caption: “Fig. 1. (a) Upper 2000 m OHC from 1955 through 2019. The histogram represents annual anomalies (units: ZJ), wherein positive anomalies relative to a 1981−2010 baseline are shown as red bars and negative anomalies as blue. The two black dashed lines are the linear trends over 1955–86 and 1987−2019, respectively.”


So here’s the hot news. According to these folks, over the last sixty years, the ocean has warmed a little over a tenth of one measly degree … now you can understand why they put it in zettajoules—it’s far more alarming that way.

Next, I’m sorry, but the idea that we can measure the temperature of the top two kilometers of the ocean with an uncertainty of ±0.003°C (three-thousandths of one degree) is simply not believable.

Also Ocean Warming Scares

Also : New 80-Year Deep-Ocean Temperature Dataset Compared to a 1D Climate Model

2019 Alaska aerial survey found the most polar bears since 2012 – dozens of fat healthy bears

by Polar Bear Science, January 12, 2020 in WUWT


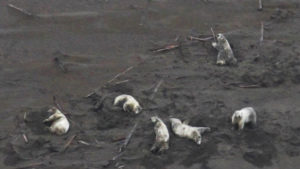
This aerial shot of six fat polar bears lolling around on a sand beach on the coast of the Southern Beaufort Sea, Alaska, was taken by NOAA employees in July 2019. It exemplifies the reality that bears in this subpopulation are currently abundant and healthy, negating the suggestion that numbers have continued to drop since 2006 because bears are starving.

The above picture of polar bear health is not an exception but the rule for all 31 bears recorded onshore last July, as the photos below from other locations testify. Those who would blame this abundance of bears on lack of sea ice in 2019 should note that ice retreated as early and as extensively in 2017 yet only 3 bears were spotted onshore. Results of a recent (2017-2018) population survey, which have not yet been made public, will of course not reflect conditions seen in 2019.

Actualité Débats Kervasdoué – Quelques vérités sur la biodiversité

by Jean de Kersvasdoué, 6 janvier 2020 in LePoint


Derrière une bataille de chiffres alarmistes se cachent des biais statistiques et des questions de fond sur ce que l’on entend par « biodiversité ».


À l’occasion des vœux à la nation, le président de la République, Emmanuel Macron, a déclaré vouloir « œuvrer en faveur de la biodiversité ». Cet objectif est noble pour de multiples raisons et, notamment, parce que certaines espèces de grands mammifères sont menacées mais aussi quelques plantes et animaux de la métropole. Les grands singes, le rhinocéros noir sont en voie d’extinction. En ce qui concerne ce dernier, selon l’UICN, il n’en restait que 5 055 têtes en 2012. Or ces animaux continuent d’être chassés pour les prétendues valeurs aphrodisiaques de leur corne revendue 40 000 dollars le kilo à Shanghai. On comprend pourquoi les braconniers les recherchent et trouvent des complicités chez des gardes mal payés qui, en outre, risquent leur vie en s’opposant aux auteurs de ces regrettables massacres. A contrario, certaines espèces que l’on croyait disparues à l’état sauvage renaissent, comme la perruche de l’île Maurice ou l’oryx d’Arabie. Toutefois, en la matière, les bonnes nouvelles sont rares et la liste des espèces menacées à l’état sauvage s’allonge dans le monde du fait de la croissance de la population de la planète et de la mise en culture d’espaces jusque-là occupés par la forêt. Des écosystèmes disparaissent et avec eux végétaux et animaux qui y vivaient. Si donc préserver ces espèces est un objectif louable, il concerne rarement la France à l’exception des forêts de Guyane, mais il la touche cependant.

En France métropolitaine, le nombre de plantes supérieures, à fleurs, dites « phanérogames », donc hors champignons, mousses, fougères, lichens, algues, etc., du territoire métropolitain est d’environ 5 000 espèces sauvages ou cultivées. Pour les vertébrés, on y trouve de l’ordre de 40 poissons d’eau douce, 40 amphibiens (ou batraciens), 40 reptiles (serpents, lézards, tortues), 400 oiseaux en comptant des migrateurs qui ne nichent pas sur le territoire national, et 80 mammifères. Au total : environ 600 vertébrés. Donc, en additionnant les végétaux supérieurs et les animaux supérieurs, au sens de l’évolution darwinienne, 5 600 espèces en France. La très grande majorité n’est pas menacée et les espèces qui sont prétendues l’être (1) ne le sont pas toujours.

L’exagération est la règle

Sur les six espèces décrites comme pouvant disparaître, il y a une plante (l’orchis couleur de lait) et cinq animaux (la sterne de l’Arctique, le lynx boréal, la grenouille des champs, la tortue d’Hermann et l’anguille). On trouve l’orchis couleur de lait dans le sud de la France et en Corse, il est difficile de mesurer la réalité de la menace qui pèse sur elle (2), faute de méthode de recensement. En ce qui concerne les espèces animales, deux ne sont en rien menacées (la sterne et le lynx boréal). Si la grenouille des champs l’est dans notre pays, elle ne l’est pas ailleurs en Europe à l’exception de la grenouille des Pyrénées. Restent la tortue d’Hermann et l’anguille européenne.

La tortue d’Hermann est la seule espèce de tortue terrestre de France. Elle est présente dans le Var et en Corse. Son habitat est détruit par les feux de forêt, le débroussaillage, le morcellement des parcelles, les routes et l’habitat pavillonnaire. Quant à l’anguille européenne (Anguilla anguilla), autrefois abondante dans tous les cours d’eau et les zones humides (lacs, étangs, marais, mares, fossés), son déclin se constate depuis 40 ans. Cette régression provient de plusieurs facteurs : divers contaminants toxiques (pesticides organochlorés bio-accumulés par l’anguille), la surpêche des civelles et des adultes de plus en plus appréciés, le braconnage, les obstacles sur la route des alevins et une augmentation du taux de parasitisme (par le nématode Anguillicola crassus) qui perturbe la migration marine des adultes. Un règlement européen (R(CE) no 1100/2007) impose des mesures de connaissance et de protection et de gestion de l’anguille et semble porter des fruits.

Continuer la lecture de Actualité Débats Kervasdoué – Quelques vérités sur la biodiversité

Carbon Sequestration

by Red Istvan, January 10, 2020 in WUWT


As most WUWT readers know, the issue of carbon sequestration is an important but largely IPCC undiscussed ‘anthropogenic global warming’ question. I got to thinking about it again as a result of the Australian brush fires that are dramatically releasing sequestered brush carbon. And it has been years since the topic was discussed in any depth here at WUWT, insofar as I know.

A cautionary note to WUWT readers. This guest post is a high level review, rather than a typically detailed and highly referenced analytic post on some paper. It is intended mainly to guide your own further research into a fairly complex subject by providing basic concepts and keywords.

Background

There is little doubt that combusting fossil fuel raises atmospheric CO2 in the ‘short term’ at some ‘rate’. This is provable several ways including C12/C13 isotope ratios governed by the differential photosynthetic uptake of the atomically lighter, therefore more ‘reactive’, C12. The experimental proof is simple: as fossil fuel combustion releases more photosynthetically sequestered C12, the residual atmospheric fraction of heavier (so less sequestered) C13 should decline. It does.

The relevant questions for global warming are the meanings of ‘rate’ and ‘short term’. We know the present rate from the Keeling Curve. That curve shows biological sink seasonality (mainly northern hemisphere terrestrial, because plants don’t grow in winter), and surprisingly slight acceleration—much less than the estimated rate of increase in gross CO2emissions from fossil fuel consumption. (Wiki has good illustrations and discussion.) This belies the ‘saturated sinks’ assumption in the Bern sequestration model because the simple gross/net comparison shows carbon sinks must be growing significantly.

We also know from that same Keeling curve that ‘short term’ is at least decades. But is it several centuries as all the IPCC AR5 climate models predict?

Different Carbon Sink Rates

.

Greenland Ice Core CO2 Concentrations Deserve Reconsideration

by Renee Hannon, January 7, 2020, in WUWT


Introduction
Ice cores datasets are important tools when reconstructing Earth’s paleoclimate. Antarctic ice core data are routinely used as proxies for past CO2 concentrations. This is because twenty years ago scientists theorized Greenland ice core CO2 data was unreliable since CO2trapped in air bubbles had potentially been altered by in-situ chemical reactions. As a result, Greenland CO2 datasets are not used in scientific studies to understand Northern and Southern hemispheres interactions and sensitivity of greenhouse gases under various climatic conditions.

This theory was put forward because Greenland CO2 data were more variable and different than Antarctic CO2 measurements located in the opposite polar region about 11,000 miles away. This article re-examines Greenland ice cores to see if they do indeed contain useful CO2 data. The theory of in-situ chemical reactions to explain a surplus and deficit of CO2, relative to Antarctic data, will be shown to be tenuous. The Greenland CO2 data demonstrates a response to the Medieval Warm Period, Little Ice Age, Dansgaard-Oeschger and other past climate change events. This response to past climate changes offers an improved explanation for why Greenland and Antarctic CO2 measurements differ. Further, Greenland CO2 measurements show rapid increases of 100 ppm during warm events in relatively short periods of time.

Atmospheric CO2 is More Variable in Northern Latitudes

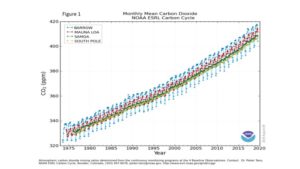
Figure 1, from NOAA, shows atmospheric CO2 concentrations measured from the continuous monitoring program at four key baseline stations spanning from the South Pole to Barrow, Alaska. CO2 has risen from about 330 ppm to over 400 ppm since 1975 and is increasing at approximately 1-2+ ppm/year. Many scientists believe that rapidly increasing CO2 is mostly due to fossil fuel emissions.

Figure 1. Atmospheric CO2 concentrations from NOAA

The Evidence Proves That CO2 is Not a Greenhouse Gas

by Tim Ball, September 13, 2018 in Technocracy.News


The Intergovernmental Panel on Climate Change (IPCC) claim of human-caused global warming (AGW) is built on the assumption that an increase in atmospheric CO2 causes an increase in global temperature. The IPCC claim is what science calls a theory, a hypothesis, or in simple English, a speculation.  Every theory is based on a set of assumptions. The standard scientific method is to challenge the theory by trying to disprove it. Karl Popper wrote about this approach in a 1963 article, Science as Falsification. Douglas Yates said,

“No scientific theory achieves public acceptance until it has been thoroughly discredited.”

Thomas Huxley made a similar observation.

“The improver of natural knowledge absolutely refuses to acknowledge authority, as such. For him, skepticism is the highest of duties; blind faith the one unpardonable sin.”

In other words, all scientists must be skeptics, which makes a mockery out of the charge that those who questioned AGW, were global warming skeptics. Michael Shermer provides a likely explanation for the effectiveness of the charge.

“Scientists are skeptics. It’s unfortunate that the word ‘skeptic’ has taken on other connotations in the culture involving nihilism and cynicism. Really, in its pure and original meaning, it’s just thoughtful inquiry.”

The scientific method was not used with the AGW theory. In fact, the exact opposite occurred, they tried to prove the theory. It is a treadmill guaranteed to make you misread, misrepresent, misuse and selectively choose data and evidence. This is precisely what the IPCC did and continued to do.

It has been hotter, fires have burnt larger areas

by J. Marohasy, January 4, 2020 in WUWT


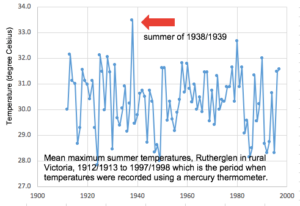
Last summer, and this summer, has been hot in Australia. But the summer of 1938-1939 was probably hotter — and back then more ferocious bushfires burnt larger areas. In rural Victoria, the summer of 1938-1939 was on average at least two degrees hotter than anything measured with equivalent equipment since, as shown in Figure 1.

Figure 1. Mean maximum summer (December, January February) temperatures as measured at Rutherglen in rural Victoria by The Australian Bureau of Meteorology for the period when mercury thermometers were used. Data unadjusted/not homogenised.

The summer of 1938-1939 was probably the hottest ever in recorded history for the states of New South Wales and Victoria. It is difficult to know for sure because the Bureau has since changed how temperatures are measured at many locations and has not provided any indication of how current electronic probes are recording relative to the earlier mercury thermometers.

Further, since 2011, the Bureau is not averaging measurements from these probes so the hottest recorded daily temperature is now a one-second spot reading from an electronic devise with a sheath of unknown thickness. In the United States similar equipment is used and the readings are averaged over five (5) minutes and then the measurement recorded.


See also: Australia Drought, The Indian Ocean Dipole & Sudden Stratospheric Warming

See also: Australia Bushfires – Is Blaming Greens a Conspiracy Theory?

See also : 24 People Charged For Setting Fires In New South Wales; Arrest Toll Hits 183

See also  : RISING LIKE A PHOENIX — AUSTRALIA’S FORESTS RENEW THEMSELVES

Energies du monde et perspectives d’un MIX 2050?

by E. Simon, 27 décembre 2019 in ScienceClimatEnergie


1/ Introduction

Face aux gesticulations de masses organisées contre les énergies fossiles et le CO2, dits nuisibles, nos amis logiciens examineront utilement la situation à l’échelle planétaire. Une situation où nos 500 millions d’habitants d’UE ne pèsent finalement que 1/15e de l’actuelle population mondiale !

Tâchons d’identifier des faits chiffrés, ils reflètent la vie réelle sur notre globe. Leurs ‘tendances lourdes’ y échappent à l’emprise des idéologues ! Si nos besoins capacitaires belges post-2025 provoquent déjà l’entrechoc d’avis entre la CREG (régulateur belge) et l’administration SPF (Energie, plus experts), il sera plus éclairant de raisonner dans une atmosphère sans frontières, à l’échelle planétaire. Là s’ajoutent les dimensions géopolitiques et divers facteurs de sensibilités culturelles. Les joutes de pouvoirs institutionnels y deviennent alors titanesques ! L’Union Européenne en restera-t-elle subordonnée aux thèses du GIEC et aux manoeuvres aux COP21 (… COP25) onusiennes ? Une thèse vaut ici : les 5 pays dits BRICS (ou Brésil/Russie/Inde/Chine/Afrique du Sud) et d’autres Etats ne suivront pas les dogmes prônés par l’ONU. Sa démonstration par l’absurde en est perceptible dans les faits. Explorons-la davantage ?

Cette note consacrée au MIX mondial passe en revue les points suivants :

• Où en sommes-nous (UE, monde) actuellement ?
• Vers où le reste du monde se dirige-t-il, à l’horizon planifié de 2040/2050 ?
• Trancher le noeud gordien des perspectives exige de chiffrer les + et les – !
• Combien cela coûtera-t-il à l’humanité (celle apte à le payer) ?
• En guise de conclusion, à ce stade …

The Myth of the Apolitical Scientist

by Donna Laframboise, October 28, 2019 in BigPictureNews


Matthew Green is not a naive teenager. He’s a seasoned journalist who has worked in Afghanistan and Pakistan, and who has written a book about a Ugandan warlord. So how do we explain the Reuters story he filed earlier this month, headlined Scientists endorse mass civil disobedience to force climate action?

Its major theme is that there’s something new going on, that the climate situation is so dire scientists have begun behaving in an extraordinary manner. 400 scientists from 20 countries have broken “with the caution traditionally associated” with their profession, he says. Having previously “shunned overt political debate,” they’ve now discovered “a moral duty” to “defy convention.”

In his 1968 bestseller, The Population Bomb, biology professor Paul Ehrlich declaredthat “the time of famines” had arrived. The only “hope for survival” was “drastic worldwide measures.” His book was a political treatise that advocated “brutal and heartless decisions” to solve a problem that never did materialize.

The 1972 bestseller, titled A Blueprint for Survival, similarly proclaimed that “a succession of famines, epidemics, social crises and wars” were inevitable if governments didn’t take specific, dramatic actions. Politicians and the public were urged to pay attention since “34 distinguished biologists, ecologists, doctors and economists” had attached their names to that blueprint.

Steinberger’s comments to the contrary, it has been a long time since we’ve had ‘science as usual.’ Here’s a quote from a book published in 1976:

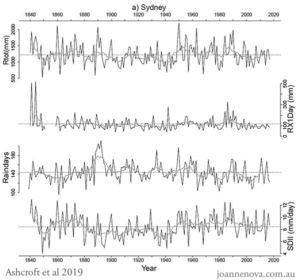
Climate change and bushfires — More rain, the same droughts, no trend, no science

by JoNova, December 24, 2019


To Recap: In order to make really Bad Fires we need the big three: Fuel, oxygen, spark.Obviously getting rid of air and lightning is beyond the budget. The only one we can control is fuel. No fuel = no fire.   Big fuel = Fireball apocalypse that we can;t stop even with help from Canada, California, and New Zealand.

The most important weather factor is rain, not an extra 1 degree of warmth. To turn the nation into a proper fireball, we “need” a good drought.  A lack of rain is a triple whammy — it dries out the ground and the fuel — and it makes the weather hotter too. Dry years are hot years in Australia, wet years are cool years. It’s just evaporative cooling for the whole country. The sun has to dry out the soil before it can heat up the air above it.  Simple yes?  El Nino’s mean less rain (in Australia), that’s why they also mean “hot weather”.

So ask a climate scientist the right questions and you’ll find out what the ABC won’t say: That global warming means more rain, not less. Droughts haven’t got worse, and climate models are really, terribly, awfully pathetically bad at predicting rain.

Four reasons carbon emissions are irrelevant

1. Droughts are the same as they ever were.

In the 178 year record, there is no trend. All that CO2 has made no difference at all to the incidence of Australian droughts. Climate scientists have shown droughts have not increased in Australia. Click the link to see Melbourne and Adelaide. Same thing.

3 degrees C?

by J. Curry, December 23, 2019 in ClimateEtc.


Is 3 C warming over the 21st century now the ‘best estimate’?  A reframing of how we think about climate change over the 21st century, and my arguments for 1 C.

There has been much discussion over on twitter of the new article by David Wallace-Wells:  We’re Getting a Clearer Picture of the Climate Future — and It’s n Not as Bad as it Once Looked.  ‘This article is interesting for several reasons, especially since Wallace-Wells has been ‘alarmist in chief.’

Simply put, it is now becoming more widely accepted that RCP8.5 concentration/emissions scenario is highly implausible.  See my previous post:

In 2020, Climate Science Needs To Hit The Reset Button (Part I)

by R. Pielke JR., December 23, 2019 in ClimateChangeDispatch


In a remarkable essay last week titled, “We’re Getting a Clearer Picture of the Climate Future — and It’s Not as Bad as It Once Looked,” David Wallace-Wells of New York Magazine wrote, “the climate news might be better than you thought. It’s certainly better than I’ve thought.”

The essay was remarkable because Wells, a self-described “alarmist,” is also the author of The Uninhabitable Earth, which describes an apocalyptic vision of the future, dominated by “elements of climate chaos.”

According to Wallace-Wells, his new-found optimism was the result of learning that much discussion of climate change is based on extreme but implausiblescenarios of the future where the world burns massive amounts of coal.

The implausibility of such scenarios is underscored by more recent assessments of global energy system trajectories of the International Energy Agency and United Nations, which suggest that carbon dioxide emissions from the burning of fossil fuels will be relatively flat over the next several decades, even before aggressive climate policies are implemented.

Scenarios of the future have long sat at the center of discussions of climate science, impacts and adaptation and mitigation policies.

Scenario-planning has a long history and can be traced to the RAND Corporation during World War 2 and, later (ironically enough) Shell, a fossil fuel company.

Scenarios are not intended to be forecasts of the future, but rather to serve as an alternative to forecasting. Scenarios provide a description of possible futurescontingent upon various factors, only some of which might be under the control of decision-makers.

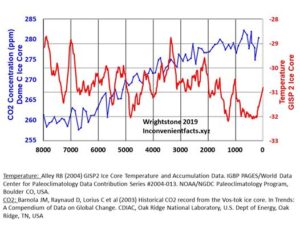
8000 Years Of Zero Correlation Between CO2 And Temperature, GISP 2 Ice Core Shows – Opposite Is True!

by P. Gosselin, December 20, 2019 in NoTricksZone


A plot of ice core data from Greenland reveals that CO2 does not drive temperatures.

At Facebook, Gregory Wrightstone posted a chart plotting atmospheric CO2 concentration reconstructed from  Dome C Ice Core versus temperature that was reconstructed from the GISP 2 Ice Core.

According to global warming scientists, there’s supposed to be tandem movement between the two magnitudes.

CO2, they say, drives global temperature.

But over the past 8000 years, the data show that temperature in reality has moved in the opposite direction of CO2 and thus of what climate alarmist scientists have told us.


If anything can be drawn from the plotted data, it is that there’s an inverse correlation: As CO2 rises, temperature drops. But of course there’s a lot more to it. CO2 is not that huge major climate driver that alarmists like having us believe it is.