Why You Shouldn’t Draw Trend Lines on Graphs

by Kip Hansen,  August 6, 2019 in WUWT


What we call a graph is more properly referred to as “a graphical representation of data.”  One very common form of graphical representation is “a diagram showing the relation between variable quantities, typically of two variables, each measured along one of a pair of axes at right angles.”

Here at WUWT we see a lot of graphs —  all sorts of graphs of a lot of different data sets.  Here is a commonly shown graph offered by NOAA taken from a piece at Climate.gov called “Did global warming stop in 1998?” by Rebecca Lindsey published on September 4, 2018.


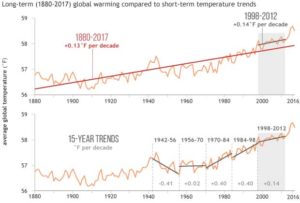
I am not interested in the details of this graphic representation — the whole thing qualifies as “silliness”.  The vertical scale is in degrees Fahrenheit and the entire range change over 140 years shown is on the scale 2.5 °F or about a degree and a half C.   The interesting thing about the graph is the effort of drawing of “trend lines” on top of the data to convey to the reader something about the data that the author of the graphic representation wants to communicate.  This “something” is an opinion — it is always an opinion — it is not part of the data.

The data is the data.  Turning the data into a graphical representation (all right, I’ll just use “graph” from here on….), making the data into a graph has already  injected opinion and personal judgement into the data through choice of start and end dates, vertical and horizontal scales and, in this case, the shading of a 15-year period at one end.  Sometimes the decisions as to vertical and horizontal scale are made by software — not rational humans —  causing even further confusion and sometimes gross misrepresentation.

Anyone who cannot see the data clearly in the top graph without the aid of the red trend lineshould find another field of study (or see their optometrist).  The bottom graph has been turned into a propaganda statement by the addition of five opinions in the form of mini-trend lines.

La localisation temporelle et géographique des stations de mesure de la température pose des problèmes

by Carl-Stéphane Huot, 30 juillet 2019 in ScienceClimatEnergie


La notion de réchauffement climatique préoccupe bon nombre de gens depuis des années. Cependant, ce réchauffement apparent pourrait être influencé par le déplacement de stations météorologiques vers les zones plus chaudes de la planète, soit plus  près de l’équateur, soit à des altitudes plus basses.  La modélisation du climat est aussi influencée par l’existence de régions sans, ou avec très peu, de stations météorologiques.

Graphique 1 : Température moyenne selon la classe de longitude.

Conclusion

La variation extrêmement élevée du nombre de stations météorologiques servant au calcul de la température mondiale a contribué depuis le début des années 1950 à une partie au moins de l’élévation de  température. La dérive de celles-ci d’une place à l’autre fausse la précision des données que l’on peut en tirer, et contribue à augmenter l’inquiétude de la population. L’emplacement et le nombre de stations à installer posent un certain nombre de problèmes autant scientifiques que techniques et  politiques, et rend, avec d’autres éléments, (par exemple l’effet d’urbanisation, non abordé ici) extrêmement difficile de parler de réchauffement climatique.

Temps far, far below normal across almost the entire territory of European Russia

by Robert, August 4, 2019 in IceAgeNow


We’re talking about record-breaking cold across an area almost half as big as the entire contiguous United States.

2 Aug 2019 – In a number of points in the north-east of the territory, the temperature dropped to record lows. In the capital of the Komi Republic, in Syktyvkar, it dropped to 2.7 degrees, which is 0.3 degrees lower than the previous record held since 1944.

Not only in the northern areas, the temperature also dropped to critical levels. In Voronezh the thermometers showed +7 degrees, leaving behind the previous record of +7.1 degrees in 1971.

Further south, in Saratov, the minimum temperature on the first day of August was 9.6, beating the previous record of 10.4 degrees set in 1948.

The cold also hit Azov. In Tsimlyansk, Rostov Region, on August 1 the temperature fell to 13.3 degrees. The previous record, 13.6, was noted in 1975.

On the first day of August, the average temperature across almost the entire territory of European Russia was 4-6 degrees below normal, and in the Volga region it did not reach the average long-term values ​​of 8 degrees.

Cold weather throughout the territory from the White to the Black Sea will continue for at least another week.

European Russia covers nearly 4,000,000 km2 (1,500,000 sq mi).
Together, the 48 contiguous states and Washington, D.C. occupy a combined area of 8,080,464.3 km2 (3,119,884.69 sq miles).

http://www.hmn.ru/index.php?index=2&nn=62368

The Sun’s Weather Cycle May Start in ‘Tsunamis,’ End with ‘Terminators’

by Passant Rabbie, July 31, 2019 in Space


A tsunami of plasma rushes through the sun before a new sunspot cycle begins.

Astronomers may have finally figured out what causes the sun’s 11-year cycle of activity, and it involves a “tsunami” of magnetic fields.

The sun, like other stars, goes through a cycle marked by a change in magnetic activity, levels of radiation, and the number and size of sunspots. While our sun’s 11-year cycle was discovered more than a century ago, predicting exactly when one cycle ends and a new one begins has been an ongoing challenge.

A pair of related studies have mapped out the sun’s activity over the course of 140 years, looking for clues about the solar cycle that are visible on the surface. By looking at the way bright flashes of ultraviolet light migrate across the sun’s surface, the researchers discovered that the sun’s mysterious 11-year cycle may be marked by a “terminator” event that ends one cycle and a “tsunami” of magnetic fields that initiates a new one. Those bright flickers of ultraviolet light and the sun’s magnetic fields appear to drive the cycle itself, and monitoring those flashes could help scientists predict when a new cycle will begin.

July 2019 Was Not the Warmest on Record

by Roy Spencer, August 2, 2019 in GlobalWarming


July 2019 was probably the 4th warmest of the last 41 years. Global “reanalysis” datasets need to start being used for monitoring of global surface temperatures. [NOTE: It turns out that the WMO, which announced July 2019 as a near-record, relies upon the ERA5 reanalysis which apparently departs substantially from the CFSv2 reanalysis, making my proposed reliance on only reanalysis data for surface temperature monitoring also subject to considerable uncertainty].


See also here

Relation entre l’ activité sismique dans les océans et le réchauffement global (août 2019)

c/o Luc Trullemans,  août 2019 in PublicMétéo


Introduction

Une forte relation à été observée ces dernières années entre de l’activité sismique dans les océans et le récent réchauffement climatique  (CSARGW ,Correlation of Seismic Activity and Recent Global Warming) .

Cette corrélation entre de l’activité sismique océanique et le réchauffement climatique avait déjà été remarquée de 1979 à 2016 (CSARGW16) et vient d’être confirmée jusqu’en 2018.

Dans cette note, on démontre que  l’activité sismique dans les océans ( =>tremblements de terre de magnitude 4-6) provoque des flux géothermiques sous-marins et ont une relation importante avec les fluctuations de la température globale des océans (SST) et de la température globale de l’air (GT).

Ceci avance une nouvelle l’hypothèse selon laquelle l’activité sismique océanique pourrait être  un des paramètres  les plus importants dans la variation de la température globale.


Greenland Ice sheet Meltdown Scare–Except It’s Not True

by P.  Homewood,  August 1, 2019 in NotaLotofPeopleKnowThat


The same heat dome that roasted Europe and broke national temperature records in five countries last week has shifted to Greenland, where it is causing one of the biggest melt events ever observed on the fragile ice sheet.

By some measures, the ice melt is more extreme than during a benchmark record event in July 2012, according to scientists analyzing the latest data. During that event, about 98 percent of the ice sheet experienced some surface melting, speeding up the process of shedding ice into the ocean.

The fate of Greenland’s ice sheet is of critical importance to every coastal resident in the world, since Greenland is already the biggest contributor to modern-day sea level rise. The pace and extent of Greenland ice melt will help determine how high sea levels climb and how quickly….

The Danish Meteorological Institute tweeted that more than half the ice sheet experienced some degree of melting on Tuesday, according to a computer model simulation, which made it the “highest this year by some distance.”

And there is no mention of the fact that the ice sheet grew substantially last year, and also the year before:

The simple fact is that the Greenland ice sheet melts every summer, particularly when the sun shines. That’s what it does. And it grows back again in winter as the snow falls. Indeed, if it did not melt, it would carry on growing year after year.

Inevitably there are some days when the weather is warmer and sunnier than normal, and others when it is colder. To pick an odd day or two is ridiculous and dishonest scaremongering.

See also here and here

MALDIVES TO OPEN FIVE NEW AIRPORTS IN 2019

by Maldives Insider, May 20, 2019


Five new airports will come into operation by the end of the year, Maldives government announced Sunday.

Transport minister Aishath Nahula told local media that construction of airports on the islands of Kulhudhuffushi in Haa Dhaal atoll, Funadhoo in Shaviyani atoll, Maafaru in Noonu atoll, Madivaru in Lhaviyani atoll and Maavarulu in Gaaf Dhaal atoll is nearing completion. Kulhudhuffushi airport will come into operation first, followed by Funadhoo and Maafaru airport in August, she said.

The airport being developed in Kulhudhuffushi, a key population zone in the north, and in Maafaru, a proposed ultra-luxury tourism zone, had earlier welcomed test flights. However, delays in the construction of terminal and other support facilities had pushed back commercial operations.

Six hectares off the southern coast of Kulhudhuffushi and another nine hectares from the island’s wetlands were reclaimed for the airport, which has a runway measuring 1,200 metres in length and 60 metres in width.

Known as the “Heart of the North”, Kulhudhuffushi is the economic capital of the northern Maldives and has a population of over 9,000, making it one of the biggest and most populous islands in the northern part of the country. The island is famous for its mangroves, after which the island itself is named.

Child miners aged four living a hell on Earth so YOU can drive an electric car

by Barbara Jones, August 5, 2017 in MailOnline


  • Sky News investigated the Katanga mines and found Dorsen, 8, and Monica, 4
  • The pair were working in the vast mines of the Democratic Republic of Congo
  • They are two of the 40,000 children working daily in the mines, checking rocks for cobalt


Eight-year-old Dorsen is pictured cowering beneath the raised hand of an overseer who warns him not to spill a rock

A voracious Cambrian predator, Cambroraster, is a new species from the Burgess Shale

by Royal Ontario Museum, July 31, 2019 in ScienceDaily


Fossils of a large new predatory species in half-a-billion-year-old rocks have been uncovered from Kootenay National Park in the Canadian Rockies. This new species has rake-like claws and a pineapple-slice-shaped mouth at the front of an enormous head, and it sheds light on the diversity of the earliest relatives of insects, crabs, spiders, and their kin.

Reaching up to a foot in length, the new species, named Cambroraster falcatus, comes from the famous 506-million-year-old Burgess Shale. “Its size would have been even more impressive at the time it was alive, as most animals living during the Cambrian Period were smaller than your little finger,” said Joe Moysiuk, a graduate student based at the Royal Ontario Museum who led the study as part of his PhD research in Ecology & Evolutionary Biology at the University of Toronto. Cambroraster was a distant cousin of the iconic Anomalocaris, the top predator living in the seas at that time, but it seems to have been feeding in a radically different way,” continued Moysiuk.

Hockey Stick Groundhog Day

by P. Homewood, August, 1, 2019 in NotaLotofPeopleKnowThat


Some ancient history

Fifteen to twenty years ago, Michael Mann and colleagues wrote a few papers claiming that current warming was unprecedented over the last 600 to 2000 years.  Other climate scientists described Mann’s work variously as crap, pathetic, sloppy, and crap.  These papers caught the interest of Stephen McIntyre and this led to the creation of his Climate Audit blog and the publication of paperspointing out the flaws in these hockey stick reconstructions. In particular, Mcintyre and his co-author Ross McKitrick showed that the method used by Mann and colleagues shifted the data in such a way that any data sets that showed an upward trend in the 20th century would receive a stronger weighting in the final reconstruction.  With this method, generation of a hockey-stick shape in the temperature reconstruction was virtually guaranteed, which M&M demonstrated by feeding in random numbers to the method.

Net Zero Natural Gas Plant — The Game Changer

by James Conca, July 31, 2019 in Forbes


An actual game changing technology is being demonstrated as we sit in our air-conditioned abodes reading this. And it is being demonstrated by North Carolina–based Net Power at a new plant in La Porte, Texas.

The process involves burning fossil fuel with oxygen instead of air to generate electricity without emitting any carbon dioxide (CO2). Not using air also avoids generating NOx, the main atmospheric and health contaminant emitted from gas plants.

Former Award-Winning NOAA scientist Dr. Rex Fleming declares his climate dissent

by Marc Morano, July 30, 2019 in Climate Depot,


Former NOAA Award-Winning Atmospheric Scientist Dr. Rex Fleming joins many former UN IPCC and U.S. government scientists publicly dissenting on man-made climate change. Fleming declares that “CO2 has no impact on climate change.”

“Past climates have been warm and cold and warm and cold with no changes in carbon dioxide. How can that be a cause when there’s no correlation.”

Fleming 8:10 on AMS, AGU, AAAS: “all 3 of those organizations will not support a “denier”..I could not get published in any of those organizations..as a denier..I had to go to Europe to publish a paper..it was peer-reviewed in Europe, it got thru, & it has been very successful”
Quote Tweet

Fleming’s work here: The Rise and Fall of the Carbon Dioxide Theory of Climate Change (2019)


‘Hidden’ NOAA temperature data reveals that 6 of the last 9 months were below normal in the USA – and NOAA can’t even get June right

by Anthony Watts, July 30, 2019 in WUWT


A review of state-of-the-art climate data tells a different story than what NOAA tells the public.

While media outlets scream “hottest ever” for the world in June and July (it’s summer) and opportunistic climate crusaders use those headlines to push the idea of a “climate crisis” the reality is for USA is that so far most of 2019 has been below normal, temperature-wise.

Little known data from the state of the art U.S. Climate Reference Network (which never seems to make it into NOAA’s monthly “state of the climate” reports) show that for the past nine months, six of them were below normal, shown in bold below.

201810 -0.18°F
201811 -2.56°F
201812 2.39°F
201901 0.63°F
201902 -3.15°F
201903 -2.81°F
201904 1.55°F
201905 -1.13°F
201906 -0.14°F

Above: Table 1, U.S. average temperature anomaly from October 2018 to June 2019. Full data file here

Fake “Heatwave for Greenland” Claims

by P. Homewood, July 30, 2019 in NotaLotofPeopleKnowThat


And that Greenland ice? The Surface Mass Balance has been well below normal throughout the winter, because of the dry weather. The rate of summer melt, however, has been pretty much normal, contrary to the fake claims of Ms Nullis.

With only a couple of weeks of melt left, it seems extremely unlikely that, even with the sunshine forecast, that the ice will dip below the 2012 figure (which incidentally is only a “record low” since records began in 1981).

http://polarportal.dk/en/greenland/surface-conditions/

New Record Temperature–But How Much Of It Is Due To UHI?

by P. Homewood, July 30, 2019 in NotaLotofPeopleKnowThat


Cambridge University Botanic Garden measured 38.7C (101.7F) on Thursday beating the previous UK record of 38.5C (101.3F), set in Kent in 2003.

A Met Office official was sent to check the equipment before verifying the new record on Monday.

Staff working at the garden on Thursday tweeted: “No wonder we all felt as if we’d melted.”

Daily temperatures have been measured by the weather station at the site in the south of the city since 1904.

Cambridge University Botanic Garden director, Beverley Glover, said: “We are really pleased that our careful recording of the weather, something that we’ve been doing every day for over 100 years at the Botanic Garden, has been useful to the Met Office in defining the scale of this latest heatwave.

“Our long history of weather recording is very important to researchers analysing climate change.

“However, we can’t help but feel dismay at the high temperature recorded and the implication that our local climate is getting hotter, with inevitable consequences for the plants and animals around us.”

https://www.bbc.co.uk/news/uk-49157898


In fact, Cambridge’s new record tells us very little about “climate change”, but an awful lot about the Urban Heat Island Effect, or UHI.

Shockingly Thick First-Year Ice In Mid-July Between Barents Sea And North Pole

by S.J. Crockford, July29, 2019 in ClimateChangeDispatch


In late June, one of the most powerful icebreakers in the world encountered such extraordinarily thick ice on-route to the North Pole (with a polar bear specialist and deep-pocketed, Attenborough-class tourists onboard) that it took a day and a half longer than expected to get there.

A few weeks later, in mid-July, a Norwegian icebreaker also bound for the North Pole (with scientific researchers onboard) was forced to turn back north of Svalbard when it unexpectedly encountered impenetrable pack ice.

Apparently, the ice charts the Norwegian captain consulted showed ‘first-year ice‘ – ice that formed the previous fall, defined as less than 2 m thick (6.6 ft) – which is often much broken up by early summer.

However, what he and his Russian colleague came up against was consolidated first-year pack ice up to 3 m thick (about 10 ft). Such thick first-year ice was not just unexpected but by definition, should have been impossible.

Ice charts for the last few years that estimate actual ice thickness (rather than age) show ice >2 m thick east and/or just north of Svalbard and around the North Pole are not unusual at this time of year.

This suggests that the propensity of navigational charts to use ice ‘age’ (e.g. first-year vs. multi-year) to describe ice conditions could explain the Norwegian captain getting caught off-guard by exceptionally thick first-year ice.

New Attempts To Erase The MWP & LIA

by P. Homewood, July 29, 2019 in NotaLotofPeopleKnowThat


There have been many attempts to get rid of the Medieval Warming Period and Little Ice Age, and here’s another one:

The science teams reconstructed the climate conditions that existed over the past 2,000 years using 700 proxy records of temperature changes, including tree rings, corals and lake sediments. They determined that none of these climate events occurred on a global scale.

https://www.bbc.co.uk/news/science-environment-49086783

As with the other failed attempts, this latest one claims that the MWP and LIA were only localised phenomena. But nothing could be further from the truth.

These three new studies rely on proxies, but time and again hockey stick studies based on proxies are proven to be fake, based on cherry picked proxies and dodgy statistics.

In fact, we have no need to rely on proxies, because the actual evidence of warm and cold periods is very real and substantial across the world.

We are all familiar with the evidence from Greenland ice cores, which clearly show both the MWP and LIA:

http://www.kaltesonne.de/temperatures-over-the-past-10000-years/